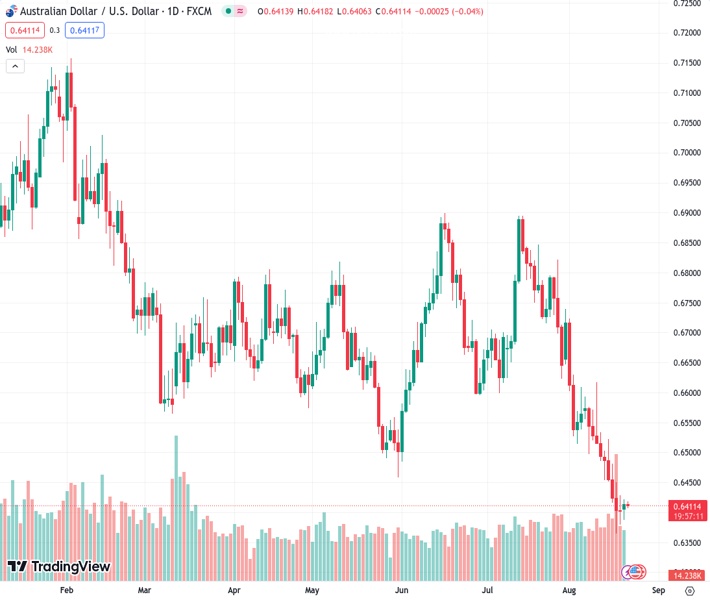
The AUDUSD pair, currently at 0.64105, loses positive sentiment at the beginning of the week due to a negative risk outlook in a slow trading session.
…
This is a premium post.
[s2If !current_user_can(access_s2member_level4)]Please register for FREE REGISTER to read full post below containing analysis. In case of any error or you think you are not able to read the full post below, please email us at support#nehcap.com [lwa][/s2If] [s2If current_user_can(access_s2member_level1)]
- AUD/USD fades week-start optimism on downbeat risk profile amid sluggish session.
The pair currently trades last at 0.64105.
The previous day high was 0.6421 while the previous day low was 0.6387. The daily 38.2% Fib levels comes at 0.6408, expected to provide support. Similarly, the daily 61.8% fib level is at 0.64, expected to provide support.
AUD/USD remains depressed around the intraday low of 0.6407 as risk aversion joins sluggish momentum early Tuesday.
The Aussie pair’s latest weakness could be linked to the multi-year high US Treasury bond yields and the fears emanating from the US banking sector, not to forget China woes.
That said, the S&P Global Ratings downgrades several US banks while highlighting the negative impacts of the higher rates and a decline in deposits. It’s worth noting that Moody’s initiated such moves early in August and triggered the risk-off mood.
With this, the US Treasury bond yields refresh the highest level since November 2007, to 4.36% at the latest, whereas S&P500 Futures fade the previous two-day rebound from the nine-week low.
Additionally, China’s efforts to defend the post-COVID economic recovery, via a slew of stimulus measures, fail to impress market optimists and exert downside pressure on the AUD/USD pair, due to the Aussie-China trade ties.
On Monday, the People’s Bank of China (PBOC), lowered the one-year Loan Prime Rate (LPR) to 3.45% from 3.55% previous and 3.40% expected. However, the Chinese central bank kept the five-year LPRs unchanged at 4.20%.
On the same line, Chinese state media Xinhua unveiled the news stating the authorities’ plan to introduce subsidies for fertilizers and pesticides in the northern region of the nation, per Reuters. Furthermore, the weekend news from China suggests the policymakers’ plan to infuse more liquidity into the world’s second-largest economy.
Alternatively, the Financial Times (FT) reported during the weekend that China pushes for competition with the Group of Seven (G7) nations while marking its presence at the BRICS meeting where officials from Brazil, Russia, India, China and South Africa spoke. Additionally, the fresh tension between China and Taiwan adds strength to the geopolitical fears but fails to gain major attention amid the cautious mood ahead of this week’s top-tier data/events.
To sum up, a light calendar at home joins the market’s anxiety ahead of this week’s August month Purchasing Managers Indexes (PMIs) and Durable Goods Orders for July, as well as the central bankers’ speeches at the annual Jackson Hole Symposium event, to prod AUD/USD rebound. That said, the US Existing Home Sales for July and Richmond Fed Manufacturing Index for August will join speeches from the mid-ties Federal Reserve (Fed) officials to direct intraday moves of the Aussie pair.
Despite the latest inaction, a one-month-old falling wedge bullish chart formation, currently between 0.6450 and 0.6315, lures AUD/USD buyers.
Technical Levels: Supports and Resistances
AUDUSD currently trading at 0.6411 at the time of writing. Pair opened at 0.6414 and is trading with a change of -0.05% % .
| Overview | Overview.1 | |
|---|---|---|
| 0 | Today last price | 0.6411 |
| 1 | Today Daily Change | -0.0003 |
| 2 | Today Daily Change % | -0.05% |
| 3 | Today daily open | 0.6414 |
The pair remains strongly bearish on the daily time frame. It trades below the 20 SMA @ 0.6557, 50 SMA 0.6669, 100 SMA @ 0.6665 and 200 SMA @ 0.6733.
| Trends | Trends.1 | |
|---|---|---|
| 0 | Daily SMA20 | 0.6557 |
| 1 | Daily SMA50 | 0.6669 |
| 2 | Daily SMA100 | 0.6665 |
| 3 | Daily SMA200 | 0.6733 |
The previous day high was 0.6421 while the previous day low was 0.6387. The daily 38.2% Fib levels comes at 0.6408, expected to provide support. Similarly, the daily 61.8% fib level is at 0.64, expected to provide support.
Note the levels of interest below:
- Pivot support is noted at 0.6394, 0.6373, 0.636
- Pivot resistance is noted at 0.6428, 0.6442, 0.6462
| Levels | Levels.1 |
|---|---|
| Previous Daily High | 0.6421 |
| Previous Daily Low | 0.6387 |
| Previous Weekly High | 0.6522 |
| Previous Weekly Low | 0.6364 |
| Previous Monthly High | 0.6895 |
| Previous Monthly Low | 0.6599 |
| Daily Fibonacci 38.2% | 0.6408 |
| Daily Fibonacci 61.8% | 0.6400 |
| Daily Pivot Point S1 | 0.6394 |
| Daily Pivot Point S2 | 0.6373 |
| Daily Pivot Point S3 | 0.6360 |
| Daily Pivot Point R1 | 0.6428 |
| Daily Pivot Point R2 | 0.6442 |
| Daily Pivot Point R3 | 0.6462 |
[/s2If]
Download Nehcap EAWe have two EAs that are operational on our LIVE accounts.
- EA-FIX: Check out the details here. Download EA-FIX . EA-FIX is a non-grid HFT scalper.
- EA-GROWTH: High quality low dd EA using trend grids. Download EA_GROWTHJoin Our Telegram Group
")


