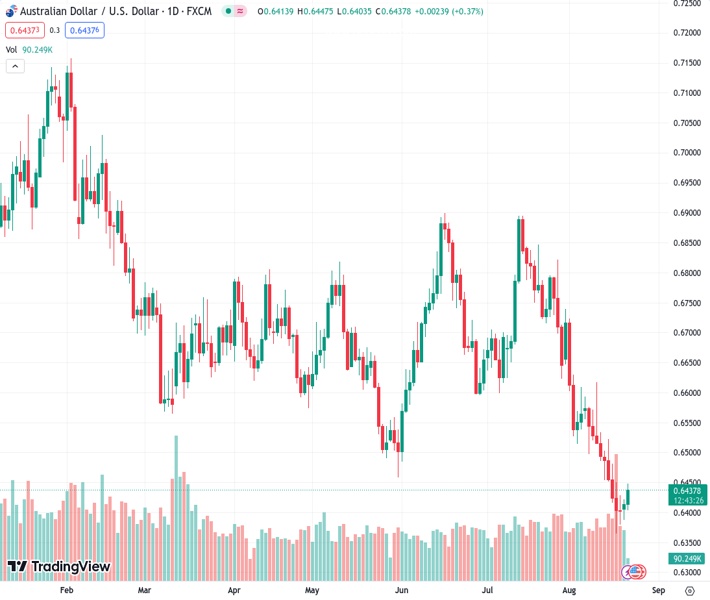
The AUD/USD currency pair at a rate of 0.64403 experiences further positive momentum and rises to its highest point in multiple days on Tuesday.
…
This is a premium post.
[s2If !current_user_can(access_s2member_level4)]Please register for FREE REGISTER to read full post below containing analysis. In case of any error or you think you are not able to read the full post below, please email us at support#nehcap.com [lwa][/s2If] [s2If current_user_can(access_s2member_level1)]
- AUD/USD gains some follow-through positive traction and climbs to a multi-day top on Tuesday.
The pair currently trades last at 0.64403.
The previous day high was 0.6421 while the previous day low was 0.6387. The daily 38.2% Fib levels comes at 0.6408, expected to provide support. Similarly, the daily 61.8% fib level is at 0.64, expected to provide support.
The AUD/USD pair attracts fresh buyers near the 0.6400 round-figure mark on Tuesday and builds on its steady intraday ascent through the early part of the European session. Spot prices recover further from the lowest level since November 2022 touched on Friday and climb to a multi-day peak, closer to mid-0.6400s in the last hour.
A modest recovery in the global risk sentiment, bolstered by hopes for more stimulus from China, prompts some selling around the safe-haven US Dollar (USD) and benefits the risk-sensitive Australian Dollar (AUD). The USD is further weighed down by a mildly softer tone surrounding the US Treasury bond yields. That said, the prospects for further policy tightening by the Federal Reserve (Fed) should act as a tailwind for the US bond yields and the Greenback.
It is worth recalling that the markets have been pricing in the possibility of one more 25 bps Fed rate hike move by the end of this year. The incoming US macro data continued to point to an extremely resilient economy and should allow the Fed to keep interest rates higher for longer. The hawkish outlook, in turn, pushed the yield on the benchmark 10-year US government bond climbed to its highest level since 2007 on Monday and favours the USD bulls.
Apart from this, concerns about the worsening economic conditions in China should keep a lid on the optimism and the China-proxy Aussie. This, along with bets for another on-hold decision by the Reserve Bank of Australia (RBA) in September, might hold back traders from placing aggressive bullish bets around the AUD/USD pair. Hence, it will be prudent to wait for strong follow-through buying before confirming that spot prices have bottomed out.
Investors might also prefer to wait on the sidelines ahead of the crucial Jackson Hole Symposium, where comments by Fed Chair Jerome Powell will be scrutinized for cues about the future rate-hike path. This, in turn, will influence the USD price dynamics and help determine the next leg of a directional move for the AUD/USD pair. Traders this week will also confront the release of the flash PMI prints from Australia and the US, due on Wednesday.
In the meantime, Tuesday’s US economic docket, featuring Existing Home Sales and Richmond Manufacturing Index, along with speeches by influential FOMC members and the US bond yields, will drive the USD demand. Furthermore, the broader market risk sentiment should contribute to producing short-term trading opportunities around the AUD/USD pair.
Technical Levels: Supports and Resistances
AUDUSD currently trading at 0.6444 at the time of writing. Pair opened at 0.6414 and is trading with a change of 0.47 % .
| Overview | Overview.1 | |
|---|---|---|
| 0 | Today last price | 0.6444 |
| 1 | Today Daily Change | 0.0030 |
| 2 | Today Daily Change % | 0.4700 |
| 3 | Today daily open | 0.6414 |
The pair remains strongly bearish on the daily time frame. It trades below the 20 SMA @ 0.6557, 50 SMA 0.6669, 100 SMA @ 0.6665 and 200 SMA @ 0.6733.
| Trends | Trends.1 | |
|---|---|---|
| 0 | Daily SMA20 | 0.6557 |
| 1 | Daily SMA50 | 0.6669 |
| 2 | Daily SMA100 | 0.6665 |
| 3 | Daily SMA200 | 0.6733 |
The previous day high was 0.6421 while the previous day low was 0.6387. The daily 38.2% Fib levels comes at 0.6408, expected to provide support. Similarly, the daily 61.8% fib level is at 0.64, expected to provide support.
Note the levels of interest below:
- Pivot support is noted at 0.6394, 0.6373, 0.636
- Pivot resistance is noted at 0.6428, 0.6442, 0.6462
| Levels | Levels.1 |
|---|---|
| Previous Daily High | 0.6421 |
| Previous Daily Low | 0.6387 |
| Previous Weekly High | 0.6522 |
| Previous Weekly Low | 0.6364 |
| Previous Monthly High | 0.6895 |
| Previous Monthly Low | 0.6599 |
| Daily Fibonacci 38.2% | 0.6408 |
| Daily Fibonacci 61.8% | 0.6400 |
| Daily Pivot Point S1 | 0.6394 |
| Daily Pivot Point S2 | 0.6373 |
| Daily Pivot Point S3 | 0.6360 |
| Daily Pivot Point R1 | 0.6428 |
| Daily Pivot Point R2 | 0.6442 |
| Daily Pivot Point R3 | 0.6462 |
[/s2If]
Download Nehcap EAWe have two EAs that are operational on our LIVE accounts.
- EA-FIX: Check out the details here. Download EA-FIX . EA-FIX is a non-grid HFT scalper.
- EA-GROWTH: High quality low dd EA using trend grids. Download EA_GROWTHJoin Our Telegram Group
")


