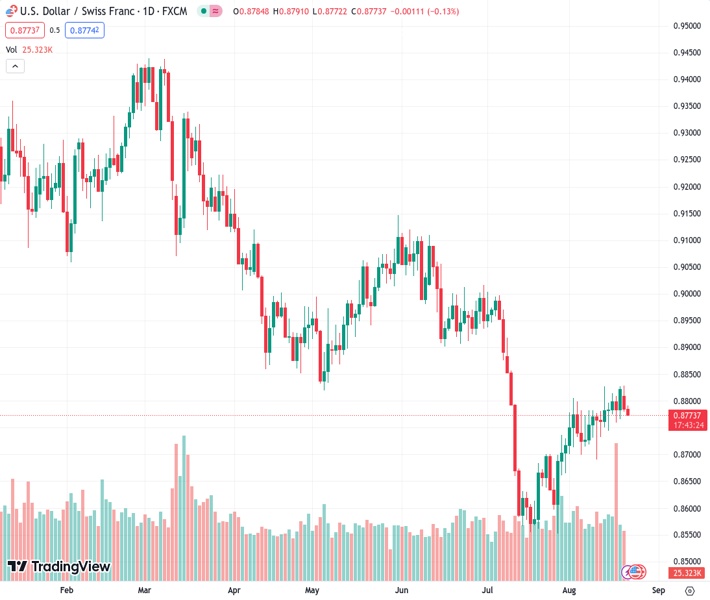
Further downside is anticipated as the USDCHF pair, currently trading at 0.87739, faces selling pressure and continues its reversal from a 1.5-month high at the beginning of the week, according to analyst @nehcap.
…
This is a premium post.
[s2If !current_user_can(access_s2member_level4)]Please register for FREE REGISTER to read full post below containing analysis. In case of any error or you think you are not able to read the full post below, please email us at support#nehcap.com [lwa][/s2If] [s2If current_user_can(access_s2member_level1)]
- USD/CHF takes offers to extend week-start reversal from 1.5-month high.
The pair currently trades last at 0.87739.
The previous day high was 0.8828 while the previous day low was 0.878. The daily 38.2% Fib levels comes at 0.8798, expected to provide resistance. Similarly, the daily 61.8% fib level is at 0.881, expected to provide resistance.
USD/CHF takes offers to extend the previous week’s U-turn from a multi-day-old resistance line amid early Tuesday, down 0.10% intraday near 0.8775 by the press time.
In doing so, the Swiss Franc (CHF) pair cheers the downside break of a one-month-long rising trend line support, now immediate resistance near 0.8790.
The trend line breakdown joins the downward-sloping RSI (14) line, not oversold, to also strengthen the bearish bias about the USD/CHF pair.
As a result, the sellers are all set to revisit the 200-SMA support of around 0.8725 before poking the 0.8700 round figure.
However, multiple levels marked during the late July highlight 0.8690 and 0.8630 will challenge the USD/CHF sellers afterward.
Meanwhile, the pair’s recovery past 0.8790 support-turned-resistance needs validation from the 0.8800 round figure and a downward-sloping resistance line from May 31, close to 0.8815 by the press time.
Following that, the double tops marked on August 14 and 21 around 0.8830 may act as the final defense of the USD/CHF bears ahead of directing the buyers toward June’s bottom surrounding 0.8900.
Overall, USD/CHF remains on the bear’s radar even if the road toward the south appears long and bumpy.
Trend: Further downside expected
Technical Levels: Supports and Resistances
USDCHF currently trading at 0.8776 at the time of writing. Pair opened at 0.8785 and is trading with a change of -0.10% % .
| Overview | Overview.1 | |
|---|---|---|
| 0 | Today last price | 0.8776 |
| 1 | Today Daily Change | -0.0009 |
| 2 | Today Daily Change % | -0.10% |
| 3 | Today daily open | 0.8785 |
The pair is trading above its 20 Daily moving average @ 0.8745, below its 50 Daily moving average @ 0.881 , below its 100 Daily moving average @ 0.8899 and below its 200 Daily moving average @ 0.9097
| Trends | Trends.1 | |
|---|---|---|
| 0 | Daily SMA20 | 0.8745 |
| 1 | Daily SMA50 | 0.8810 |
| 2 | Daily SMA100 | 0.8899 |
| 3 | Daily SMA200 | 0.9097 |
The previous day high was 0.8828 while the previous day low was 0.878. The daily 38.2% Fib levels comes at 0.8798, expected to provide resistance. Similarly, the daily 61.8% fib level is at 0.881, expected to provide resistance.
Note the levels of interest below:
- Pivot support is noted at 0.8767, 0.875, 0.8719
- Pivot resistance is noted at 0.8815, 0.8846, 0.8863
| Levels | Levels.1 |
|---|---|
| Previous Daily High | 0.8828 |
| Previous Daily Low | 0.8780 |
| Previous Weekly High | 0.8828 |
| Previous Weekly Low | 0.8738 |
| Previous Monthly High | 0.9005 |
| Previous Monthly Low | 0.8552 |
| Daily Fibonacci 38.2% | 0.8798 |
| Daily Fibonacci 61.8% | 0.8810 |
| Daily Pivot Point S1 | 0.8767 |
| Daily Pivot Point S2 | 0.8750 |
| Daily Pivot Point S3 | 0.8719 |
| Daily Pivot Point R1 | 0.8815 |
| Daily Pivot Point R2 | 0.8846 |
| Daily Pivot Point R3 | 0.8863 |
[/s2If]
Download Nehcap EAWe have two EAs that are operational on our LIVE accounts.
- EA-FIX: Check out the details here. Download EA-FIX . EA-FIX is a non-grid HFT scalper.
- EA-GROWTH: High quality low dd EA using trend grids. Download EA_GROWTHJoin Our Telegram Group
")


