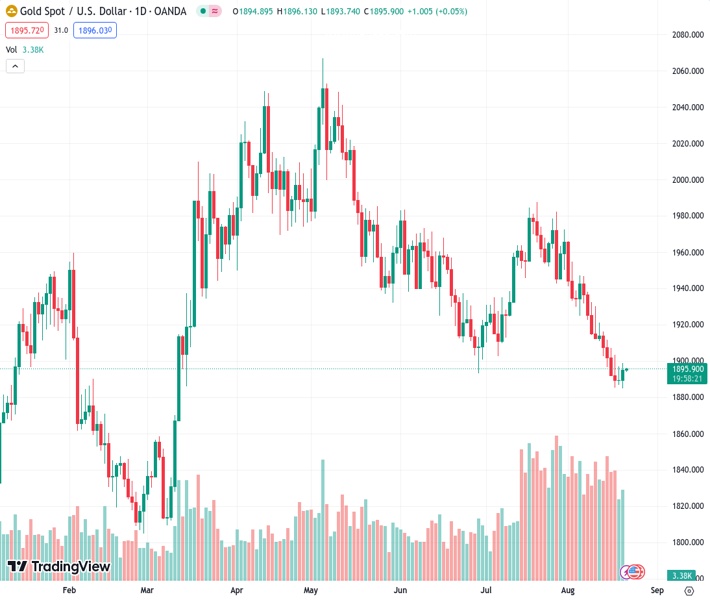
During the Asian trading session, the price of gold remains within a specific range below the $1,900 level.
…
This is a premium post.
[s2If !current_user_can(access_s2member_level4)]Please register for FREE REGISTER to read full post below containing analysis. In case of any error or you think you are not able to read the full post below, please email us at support#nehcap.com [lwa][/s2If] [s2If current_user_can(access_s2member_level1)]
- Gold price consolidates in a range below the $1,900 mark during the Asian session.
The pair currently trades last at 1895.40.
The previous day high was 1898.83 while the previous day low was 1884.85. The daily 38.2% Fib levels comes at 1893.49, expected to provide support. Similarly, the daily 61.8% fib level is at 1890.19, expected to provide support.
Gold price struggles to capitalize on the previous day’s positive move and oscillates in a narrow trading range below the $1,900 mark during the Asian session on Tuesday. The XAU/USD, for now, seems to have stalled its recent decline witnessed over the past four weeks or so, to the lowest level since March 2023, around the $1,885 region touched last Thursday as traders keenly await more cues about the Federal Reserve’s (Fed) policy outlook.
Hence, the market focus will remain glued to the Jackson Hole Symposium later this week, where comments by Fed Chair Jerome Powell will be scrutinized closely for signals on the Fed’s future rate-hike path. This will play a key role in determining the near-term trajectory for the non-yielding Gold price. In the meantime, growing acceptance that the Fed will keep interest rates higher for longer assists the US Dollar (USD) to hold steady just below its highest level in more than two months and acts as a headwind for the US Dollar-denominated commodity.
The Fed is expected to pause its rate-hiking cycle in September, though the markets are still pricing in the possibility of one more 25 basis points (bps) lift-off by the end of this year. The bets were lifted by the United States (US) Consumer Price Index (CPI) and the Producer Price Index (PPI), which suggested that the battle to bring inflation back to the Fed’s 2% target is far from being won. Moreover, the incoming US macro data continues to point to an extremely resilient economy and support prospects for further policy tightening by the Fed.
Hawkish Fed expectations, meanwhile, remain supportive of elevated US Treasury bond yields and continue to underpin the USD. That said, a generally weaker risk tone might continue to lend some support to the safe-haven Gold price. Investors remain concerned about the worsening economic conditions in China. Moreover, a smaller rate by the People’s Bank of China (PBoC) on Monday, despite worries about a deepening crisis in China’s property sector, signals limited policy support for the economy and takes its toll on the risk sentiment.
The aforementioned mixed fundamental backdrop, meanwhile, warrants some caution before placing aggressive directional bets around the Gold price heading into the key event risk. In the meantime, traders on Tuesday will take cues from the US economic docket, featuring the release of Existing Home Sales and Richmond Manufacturing Index later during the early North American session. Apart from this, speeches by a slew of influential FOMC members will play a key role in driving the USD demand and providing some impetus to the XAU/USD.
Technical Levels: Supports and Resistances
XAUUSD currently trading at 1895.39 at the time of writing. Pair opened at 1894.93 and is trading with a change of 0.02 % .
| Overview | Overview.1 | |
|---|---|---|
| 0 | Today last price | 1895.39 |
| 1 | Today Daily Change | 0.46 |
| 2 | Today Daily Change % | 0.02 |
| 3 | Today daily open | 1894.93 |
The pair remains strongly bearish on the daily time frame. It trades below the 20 SMA @ 1927.02, 50 SMA 1933.88, 100 SMA @ 1961.92 and 200 SMA @ 1907.35.
| Trends | Trends.1 | |
|---|---|---|
| 0 | Daily SMA20 | 1927.02 |
| 1 | Daily SMA50 | 1933.88 |
| 2 | Daily SMA100 | 1961.92 |
| 3 | Daily SMA200 | 1907.35 |
The previous day high was 1898.83 while the previous day low was 1884.85. The daily 38.2% Fib levels comes at 1893.49, expected to provide support. Similarly, the daily 61.8% fib level is at 1890.19, expected to provide support.
Note the levels of interest below:
- Pivot support is noted at 1886.91, 1878.89, 1872.93
- Pivot resistance is noted at 1900.89, 1906.85, 1914.87
| Levels | Levels.1 |
|---|---|
| Previous Daily High | 1898.83 |
| Previous Daily Low | 1884.85 |
| Previous Weekly High | 1916.29 |
| Previous Weekly Low | 1885.13 |
| Previous Monthly High | 1987.54 |
| Previous Monthly Low | 1902.77 |
| Daily Fibonacci 38.2% | 1893.49 |
| Daily Fibonacci 61.8% | 1890.19 |
| Daily Pivot Point S1 | 1886.91 |
| Daily Pivot Point S2 | 1878.89 |
| Daily Pivot Point S3 | 1872.93 |
| Daily Pivot Point R1 | 1900.89 |
| Daily Pivot Point R2 | 1906.85 |
| Daily Pivot Point R3 | 1914.87 |
[/s2If]
Download Nehcap EAWe have two EAs that are operational on our LIVE accounts.
- EA-FIX: Check out the details here. Download EA-FIX . EA-FIX is a non-grid HFT scalper.
- EA-GROWTH: High quality low dd EA using trend grids. Download EA_GROWTHJoin Our Telegram Group
")


