USDCHF is staying at its highest level in six weeks without showing any movement.
…
This is a premium post.
[s2If !current_user_can(access_s2member_level4)]Please register for FREE REGISTER to read full post below containing analysis. In case of any error or you think you are not able to read the full post below, please email us at support#nehcap.com [lwa][/s2If] [s2If current_user_can(access_s2member_level1)]
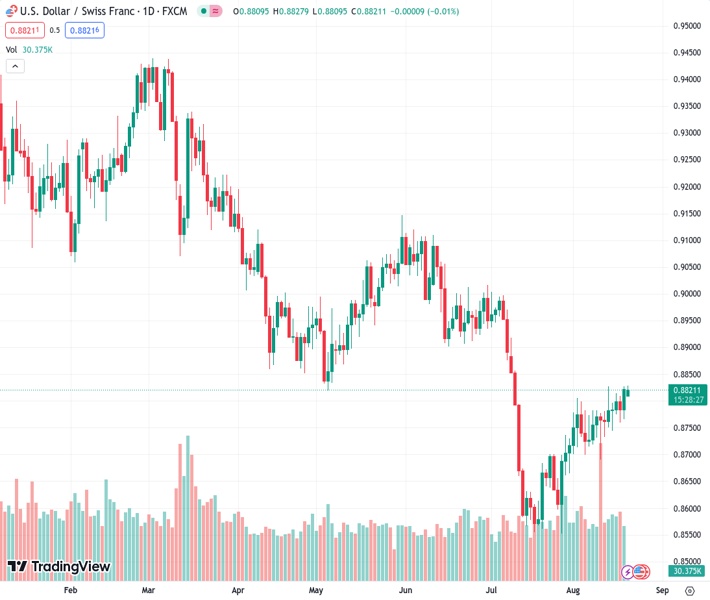
- USD/CHF remains idle at the highest level in six weeks.
The pair currently trades last at 0.88209.
The previous day high was 0.8828 while the previous day low was 0.8774. The daily 38.2% Fib levels comes at 0.8807, expected to provide support. Similarly, the daily 61.8% fib level is at 0.8794, expected to provide support.
USD/CHF lacks clear momentum around 0.8820, after refreshing a six-week high to 0.8828 heading into Monday’s European session. In doing so, the Swiss Franc (CHF) pair portrays the market’s indecision ahead of the top-tier data/events.
Among them, the August month Purchasing Managers Indexes (PMIs) and China news, as well as the top-tier central bankers’ speeches at the annual Jackson Hole Symposium event, gain major attention.
That said, China’s efforts to restore market confidence and mixed concerns about the US Federal Reserve (Fed) add strength to the USD/CHF inaction as traders seek to determine the major central bankers’ take on the monetary policy measures by the top-tier central bankers. It should be noted that the policy pivot concerned weighed on the US Dollar in July before the firmer US statistics and upbeat Treasury bond yields favored the Greenback buyers.
Elsewhere, China took multiple measures, via the central bank and fiscal policies, to infuse liquidity into the markets and defend the world’s second-largest economy from slipping into recession. That said, the People’s Bank of China (PBOC), lowered the one-year Loan Prime Rate (LPR) to 3.45% from 3.55% previous and 3.40% expected.
Apart from that, the geopolitical concerns about Taiwan, Russia and the likely trade war between the Group of Seven (G7) nations and the BRICS nations including Brazil, Russia, India, China and South Africa, per the Financial Times (FT) also put a floor under the USD/CHF price. Meanwhile, the cautious mood and a lack of major data/events check the pair buyers.
Amid these plays, the S&P500 Futures print mild gains around 4,390 to extend the previous day’s rebound from the lowest level since mid-June. On the same line, the US 10-year Treasury bond yields also reverse Friday’s retreat by rising back to 4.29% at the latest.
While the central bankers are likely to entertain the USD/CHF pair traders, Friday’s Swiss employment change for the second quarter (Q2) 2023 and the US Durable Goods Orders are some extra filters toward the north to watch for clear directions.
USD/CHF edges higher past the 50-DMA hurdle, now immediate support around 0.8810, to aim for a downward-sloping resistance line from early March, close to 0.8870 by the press time.
Technical Levels: Supports and Resistances
USDCHF currently trading at 0.8821 at the time of writing. Pair opened at 0.8823 and is trading with a change of -0.02% % .
| Overview | Overview.1 | |
|---|---|---|
| 0 | Today last price | 0.8821 |
| 1 | Today Daily Change | -0.0002 |
| 2 | Today Daily Change % | -0.02% |
| 3 | Today daily open | 0.8823 |
The pair is trading above its 20 Daily moving average @ 0.8741, above its 50 Daily moving average @ 0.8816 , below its 100 Daily moving average @ 0.8903 and below its 200 Daily moving average @ 0.91
| Trends | Trends.1 | |
|---|---|---|
| 0 | Daily SMA20 | 0.8741 |
| 1 | Daily SMA50 | 0.8816 |
| 2 | Daily SMA100 | 0.8903 |
| 3 | Daily SMA200 | 0.9100 |
The previous day high was 0.8828 while the previous day low was 0.8774. The daily 38.2% Fib levels comes at 0.8807, expected to provide support. Similarly, the daily 61.8% fib level is at 0.8794, expected to provide support.
Note the levels of interest below:
- Pivot support is noted at 0.8789, 0.8754, 0.8735
- Pivot resistance is noted at 0.8842, 0.8862, 0.8896
| Levels | Levels.1 |
|---|---|
| Previous Daily High | 0.8828 |
| Previous Daily Low | 0.8774 |
| Previous Weekly High | 0.8828 |
| Previous Weekly Low | 0.8738 |
| Previous Monthly High | 0.9005 |
| Previous Monthly Low | 0.8552 |
| Daily Fibonacci 38.2% | 0.8807 |
| Daily Fibonacci 61.8% | 0.8794 |
| Daily Pivot Point S1 | 0.8789 |
| Daily Pivot Point S2 | 0.8754 |
| Daily Pivot Point S3 | 0.8735 |
| Daily Pivot Point R1 | 0.8842 |
| Daily Pivot Point R2 | 0.8862 |
| Daily Pivot Point R3 | 0.8896 |
[/s2If]
Download Nehcap EAWe have two EAs that are operational on our LIVE accounts.
- EA-FIX: Check out the details here. Download EA-FIX . EA-FIX is a non-grid HFT scalper.
- EA-GROWTH: High quality low dd EA using trend grids. Download EA_GROWTHJoin Our Telegram Group
")


