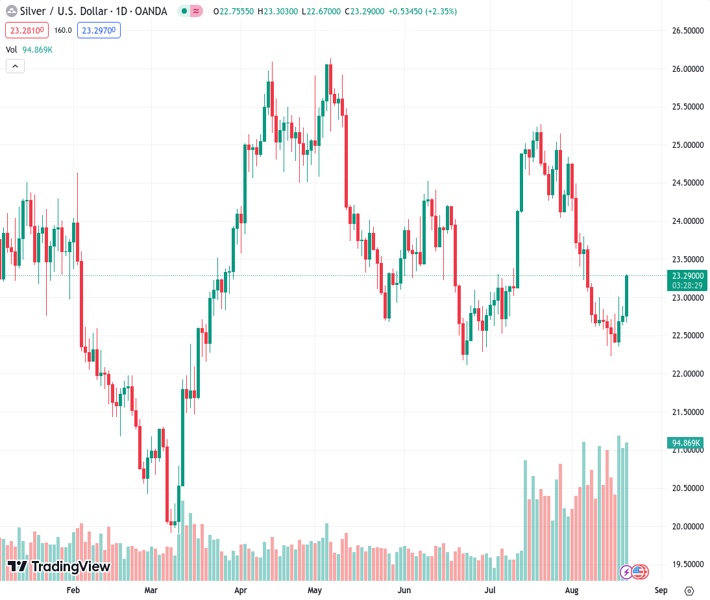
The XAGUSD price rose to 23.278, making progress and increasing by more than 2% daily. It also moved towards the 200-day simple moving average (SMA).
…
This is a premium post.
[s2If !current_user_can(access_s2member_level4)]Please register for FREE REGISTER to read full post below containing analysis. In case of any error or you think you are not able to read the full post below, please email us at support#nehcap.com [lwa][/s2If] [s2If current_user_can(access_s2member_level1)]
- The XAG/USD gained ground rising towards the 200-day SMA seeing more than 2% daily gains
The pair currently trades last at 23.278.
The previous day high was 22.89 while the previous day low was 22.64. The daily 38.2% Fib levels comes at 22.79, expected to provide support. Similarly, the daily 61.8% fib level is at 22.73, expected to provide support.
The XAG/USD rose near the 200-day Simple Moving Average (SMA) towards the $23.20 area, mainly driven by a softer USD. Investors await Thursday’s annual Jackson Hole Symposium, which may cause volatility in bond markets and the Silver price dynamics. As for now, US yields are rising, limiting further Silver´s gains.
On Thursday, Jerome Powell from the Federal Reserve (Fed) will deliver a speech at the annual Jackson Hole Symposium, which will likely ramp up volatility in the USD and the US bond market price dynamics. As for now, the US economy is holding firm and inflation is seeing a mixed picture, so clues regarding forward guidance will set the pace for the US yield dynamics and affect the non-yielding Silver.
According to the CME FedWatch tool, markets are confident that the Fed won’t hike in September, while the odds of a 25 basis point (bps) increase rise near 40% in November. However, those bets will likely change after Chair Powell’s speech on Thursday.
Observing the daily chart, the outlook is neutral to bullish for the short term as the bulls are gaining momentum but still have some work to do. Exhibiting a rising slope below its midline, the Relative Strength Index (RSI) suggests a potential bullish resurgence, while the Moving Average Convergence (MACD) lays out lower red bars. Additionally, the pair is below the 20,100 and 200-day Simple Moving Averages (SMAs), suggesting that the bears are firmly in control of the bigger picture.
Support levels: $23.00, $22.90, $22.50.
Resistance levels: $23.30 (200-day SMA), $23.50, $24.00.
Technical Levels: Supports and Resistances
XAGUSD currently trading at 23.28 at the time of writing. Pair opened at 22.77 and is trading with a change of 2.24 % .
| Overview | Overview.1 | |
|---|---|---|
| 0 | Today last price | 23.28 |
| 1 | Today Daily Change | 0.51 |
| 2 | Today Daily Change % | 2.24 |
| 3 | Today daily open | 22.77 |
The pair remains strongly bearish on the daily time frame. It trades below the 20 SMA @ 23.47, 50 SMA 23.53, 100 SMA @ 24.01 and 200 SMA @ 23.29.
| Trends | Trends.1 | |
|---|---|---|
| 0 | Daily SMA20 | 23.47 |
| 1 | Daily SMA50 | 23.53 |
| 2 | Daily SMA100 | 24.01 |
| 3 | Daily SMA200 | 23.29 |
The previous day high was 22.89 while the previous day low was 22.64. The daily 38.2% Fib levels comes at 22.79, expected to provide support. Similarly, the daily 61.8% fib level is at 22.73, expected to provide support.
Note the levels of interest below:
- Pivot support is noted at 22.64, 22.51, 22.39
- Pivot resistance is noted at 22.89, 23.02, 23.15
| Levels | Levels.1 |
|---|---|
| Previous Daily High | 22.89 |
| Previous Daily Low | 22.64 |
| Previous Weekly High | 23.01 |
| Previous Weekly Low | 22.23 |
| Previous Monthly High | 25.27 |
| Previous Monthly Low | 22.52 |
| Daily Fibonacci 38.2% | 22.79 |
| Daily Fibonacci 61.8% | 22.73 |
| Daily Pivot Point S1 | 22.64 |
| Daily Pivot Point S2 | 22.51 |
| Daily Pivot Point S3 | 22.39 |
| Daily Pivot Point R1 | 22.89 |
| Daily Pivot Point R2 | 23.02 |
| Daily Pivot Point R3 | 23.15 |
[/s2If]
Download Nehcap EAWe have two EAs that are operational on our LIVE accounts.
- EA-FIX: Check out the details here. Download EA-FIX . EA-FIX is a non-grid HFT scalper.
- EA-GROWTH: High quality low dd EA using trend grids. Download EA_GROWTHJoin Our Telegram Group
")


