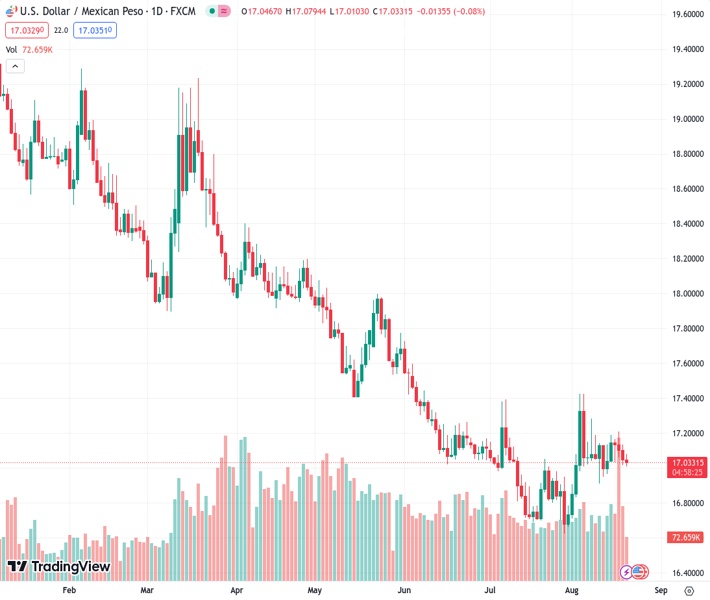
The US dollar to Mexican peso exchange rate is at 17.0303, and Wall Street is displaying optimistic indicators. However, the positive outlook is being undermined by China’s decision to reduce interest rates and encourage higher levels of borrowing, which is having a negative impact on overall global sentiment.
…
This is a premium post.
[s2If !current_user_can(access_s2member_level4)]Please register for FREE REGISTER to read full post below containing analysis. In case of any error or you think you are not able to read the full post below, please email us at support#nehcap.com [lwa][/s2If] [s2If current_user_can(access_s2member_level1)]
- Wall Street shows positive signs, but China’s rate cut and push for increased lending dampen global sentiment.
The pair currently trades last at 17.0303.
The previous day high was 17.1366 while the previous day low was 17.0167. The daily 38.2% Fib levels comes at 17.0625, expected to provide resistance. Similarly, the daily 61.8% fib level is at 17.0908, expected to provide resistance.
USDMXN registers minimal gains even though a risk-on impulse would usually underpin the emerging market currency. Monday’s light economic calendar would leave traders adrift to sentiment weighed by China’s woes and US Dollar (USD) dynamics. The USD/MXN exchanges hands at 17.0620, gaining 0.01%.
Wall Street trades positively, portraying investors’ mood improved ahead of the Jackson Hole Symposium, organized by the Kansas City Fed in Wyoming. US Treasury bond yields advance, slightly underpinning the greenback, which remains flat at 103.472, as shown by its US Dollar Index (DXY).
China’s woes weighed on investors’ sentiment after the People’s Bank of China (PboC) cut rates on its 1-year Loan Prime Rate from 3.55% to 3.45%, disappointing analysts. As reported by Bloomberg, it’s said that PboC’s officials and government regulators told lenders to boost loans to support recovery.
In the meantime, a National Association of Business Economics (NABE) poll showed economists are more confident that the Fed would pull a soft landing, as revealed by Bloomberg.
The upcoming United States (US) calendar will reveal Existing Home Sales, Fed speakers, New Home Sales, S&P Global PMIs, Jobless Claims, Durable Good Orders, and Fed Chair Jerome Powell’s speech on Friday.
Across the border, the Mexican economic docket would witness the release of inflation figures for the first half of August and the second quarter Gross Domestic Product (GDP) report on Friday.
Given the backdrop, if the Mexican economy weakens, expect the USD/MXN to appreciate further. Likewise, dovish signals by Fed officials and Jerome Powell’s speech would be repriced by traders, weakening the USD/MXN pair.
The USD/MXN remains subdued, unable to crack below/above support and resistance levels, each at 17.0000/17.1878. On the downside, the confluence of the 50 and 20-day Moving Averages (DMAs) at 17.0060/17.0160 emerged as a solid support level, which, if cleared, the USD/MXN could dip towards the year-to-date (YTD) low of 16.6238. Conversely, if USD/MXN breaks above 17.1878, the pair could rally towards the 100-DMA at 17.4135.
Technical Levels: Supports and Resistances
USDMXN currently trading at 17.0412 at the time of writing. Pair opened at 17.057 and is trading with a change of -0.09 % .
| Overview | Overview.1 | |
|---|---|---|
| 0 | Today last price | 17.0412 |
| 1 | Today Daily Change | -0.0158 |
| 2 | Today Daily Change % | -0.0900 |
| 3 | Today daily open | 17.0570 |
The pair is trading above its 20 Daily moving average @ 17.0056, above its 50 Daily moving average @ 17.0284 , below its 100 Daily moving average @ 17.4305 and below its 200 Daily moving average @ 18.1906
| Trends | Trends.1 | |
|---|---|---|
| 0 | Daily SMA20 | 17.0056 |
| 1 | Daily SMA50 | 17.0284 |
| 2 | Daily SMA100 | 17.4305 |
| 3 | Daily SMA200 | 18.1906 |
The previous day high was 17.1366 while the previous day low was 17.0167. The daily 38.2% Fib levels comes at 17.0625, expected to provide resistance. Similarly, the daily 61.8% fib level is at 17.0908, expected to provide resistance.
Note the levels of interest below:
- Pivot support is noted at 17.0036, 16.9502, 16.8837
- Pivot resistance is noted at 17.1235, 17.19, 17.2434
| Levels | Levels.1 |
|---|---|
| Previous Daily High | 17.1366 |
| Previous Daily Low | 17.0167 |
| Previous Weekly High | 17.2094 |
| Previous Weekly Low | 16.9663 |
| Previous Monthly High | 17.3957 |
| Previous Monthly Low | 16.6258 |
| Daily Fibonacci 38.2% | 17.0625 |
| Daily Fibonacci 61.8% | 17.0908 |
| Daily Pivot Point S1 | 17.0036 |
| Daily Pivot Point S2 | 16.9502 |
| Daily Pivot Point S3 | 16.8837 |
| Daily Pivot Point R1 | 17.1235 |
| Daily Pivot Point R2 | 17.1900 |
| Daily Pivot Point R3 | 17.2434 |
[/s2If]
Download Nehcap EAWe have two EAs that are operational on our LIVE accounts.
- EA-FIX: Check out the details here. Download EA-FIX . EA-FIX is a non-grid HFT scalper.
- EA-GROWTH: High quality low dd EA using trend grids. Download EA_GROWTHJoin Our Telegram Group
")


