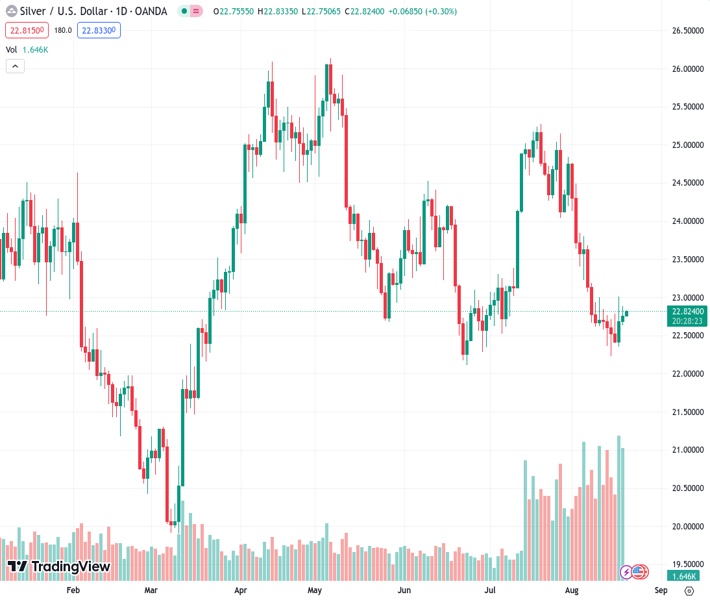
The price of silver, indicated as #XAGUSD at 22.820, continues to rise for the third day in a row after rebounding from the Golden Fibonacci ratio. Nehcap has a viewpoint that only a modest recovery is anticipated.
…
This is a premium post.
[s2If !current_user_can(access_s2member_level4)]Please register for FREE REGISTER to read full post below containing analysis. In case of any error or you think you are not able to read the full post below, please email us at support#nehcap.com [lwa][/s2If] [s2If current_user_can(access_s2member_level1)]
- Silver Price remains on the front foot for third consecutive day after bouncing off Golden Fibonacci ratio.
The pair currently trades last at 22.820.
The previous day high was 22.89 while the previous day low was 22.64. The daily 38.2% Fib levels comes at 22.79, expected to provide support. Similarly, the daily 61.8% fib level is at 22.73, expected to provide support.
Silver Price (XAG/USD) prints mild gains around $22.80 as it prints a three-day winning steak amid early Monday in Asia. In doing so, the bright metal not only justifies Friday’s daily closing beyond the 10-DMA but also extends the previous week’s rebound from the 61.8% Fibonacci retracement of the March–May upside, also known as the “Golden Fibonacci Ratio”.
Adding credence to the bullish bias is the RSI (14) line’s gradual recovery from the oversold territory, as well as the easing bearish bias of the MACD signals.
As a result, the Silver Price is likely to regain the $23.00 mark.
However, a convergence of the 200-DMA and previous support line from early March, close to $23.30 by the press time, appears a tough nut to crack for the XAG/USD bulls before retaking control.
On the contrary, a daily closing beneath the stated “Golden Fibonacci Ratio” of around $22.25 isn’t an invitation to the Silver sellers as the lows marked in late March and June around $22.10, quickly followed by the $22.00 round figure will restrict the metal’s further downside.
In a case where the XAG/USD drops below $22.00, it becomes vulnerable to plunge toward an early March swing low of around $21.30.
Trend: Limited recovery expected
Technical Levels: Supports and Resistances
XAGUSD currently trading at 22.82 at the time of writing. Pair opened at 22.77 and is trading with a change of 0.22% % .
| Overview | Overview.1 | |
|---|---|---|
| 0 | Today last price | 22.82 |
| 1 | Today Daily Change | 0.05 |
| 2 | Today Daily Change % | 0.22% |
| 3 | Today daily open | 22.77 |
The pair remains strongly bearish on the daily time frame. It trades below the 20 SMA @ 23.47, 50 SMA 23.53, 100 SMA @ 24.01 and 200 SMA @ 23.29.
| Trends | Trends.1 | |
|---|---|---|
| 0 | Daily SMA20 | 23.47 |
| 1 | Daily SMA50 | 23.53 |
| 2 | Daily SMA100 | 24.01 |
| 3 | Daily SMA200 | 23.29 |
The previous day high was 22.89 while the previous day low was 22.64. The daily 38.2% Fib levels comes at 22.79, expected to provide support. Similarly, the daily 61.8% fib level is at 22.73, expected to provide support.
Note the levels of interest below:
- Pivot support is noted at 22.64, 22.51, 22.39
- Pivot resistance is noted at 22.89, 23.02, 23.15
| Levels | Levels.1 |
|---|---|
| Previous Daily High | 22.89 |
| Previous Daily Low | 22.64 |
| Previous Weekly High | 23.01 |
| Previous Weekly Low | 22.23 |
| Previous Monthly High | 25.27 |
| Previous Monthly Low | 22.52 |
| Daily Fibonacci 38.2% | 22.79 |
| Daily Fibonacci 61.8% | 22.73 |
| Daily Pivot Point S1 | 22.64 |
| Daily Pivot Point S2 | 22.51 |
| Daily Pivot Point S3 | 22.39 |
| Daily Pivot Point R1 | 22.89 |
| Daily Pivot Point R2 | 23.02 |
| Daily Pivot Point R3 | 23.15 |
[/s2If]
Download Nehcap EAWe have two EAs that are operational on our LIVE accounts.
- EA-FIX: Check out the details here. Download EA-FIX . EA-FIX is a non-grid HFT scalper.
- EA-GROWTH: High quality low dd EA using trend grids. Download EA_GROWTHJoin Our Telegram Group
")


