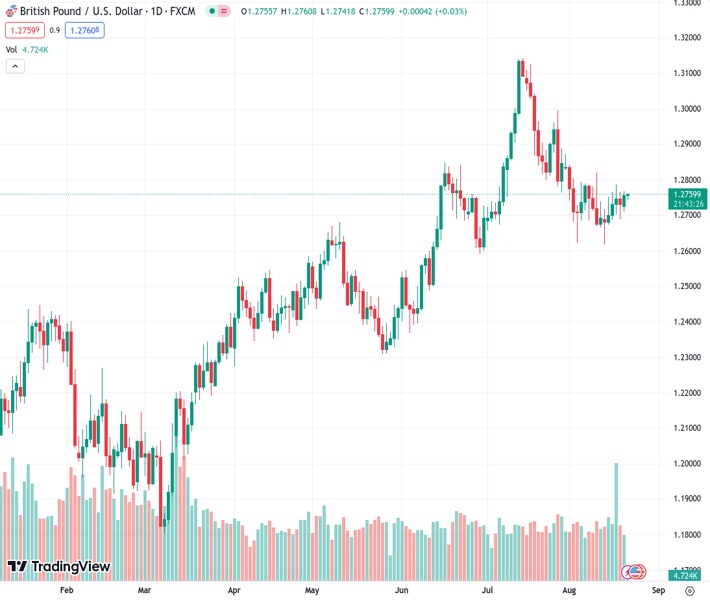
The GBPUSD pair, currently at 1.27597, is showing slight upward movement after experiencing its first weekly increase in five weeks. @nehcap predicts that there will be additional gains in the future.
…
This is a premium post.
[s2If !current_user_can(access_s2member_level4)]Please register for FREE REGISTER to read full post below containing analysis. In case of any error or you think you are not able to read the full post below, please email us at support#nehcap.com [lwa][/s2If] [s2If current_user_can(access_s2member_level1)]
- GBP/USD edges higher after posting the first weekly gain in five.
The pair currently trades last at 1.27597.
The previous day high was 1.2766 while the previous day low was 1.2689. The daily 38.2% Fib levels comes at 1.2719, expected to provide support. Similarly, the daily 61.8% fib level is at 1.2737, expected to provide support.
GBP/USD seesaws around 1.2755-60 as bulls hit barriers during early Tuesday in Asia, snapping a four-week downtrend, as well as posting a firmer start of the week.
The Guardian came out with the news quoting Britain’s opposition Labour Party leader Keir Starmer to mention that UK growth is forecast to be slowest in the Group of Seven Nations (G7). The news also cites the opposition party terming the British economy as stuck in a low-growth trap.
Apart from that, the market’s cautious mood ahead of this week’s top-tier central bankers’ speeches at the Jackson Hole Symposium also prods the GBP/USD buyers.
However, a three-week-old bullish triangle formation and an impending bull cross on the MACD lure the GBP/USD pair buyers after it managed to cross the five-week-old descending resistance line, now immediate support near 1.2700, the last week.
That said, the stated triangle’s top line, around 1.2770 by the press time, restricts the immediate upside of the Pound Sterling ahead of the 50-DMA level of 1.2800.
Following that, June’s peak of around 1.2850 and the late July swing high near 1.2870 may test the Cable buyers before giving them control.
On the contrary, a downside break of the resistance-turned-support surrounding 1.2700 will defy the bullish bias and may drag the GBP/USD price toward the 100-DMA support of near 1.2630.
Even so, the Pound Sterling bears will remain cautious unless witnessing a daily closing below the aforementioned triangle’s bottom line, close to 1.2615 by the press time.
Trend: Further upside expected
Technical Levels: Supports and Resistances
GBPUSD currently trading at 1.2757 at the time of writing. Pair opened at 1.2734 and is trading with a change of 0.18% % .
| Overview | Overview.1 | |
|---|---|---|
| 0 | Today last price | 1.2757 |
| 1 | Today Daily Change | 0.0023 |
| 2 | Today Daily Change % | 0.18% |
| 3 | Today daily open | 1.2734 |
The pair is trading below its 20 Daily moving average @ 1.2766, below its 50 Daily moving average @ 1.2788 , above its 100 Daily moving average @ 1.2628 and above its 200 Daily moving average @ 1.2379
| Trends | Trends.1 | |
|---|---|---|
| 0 | Daily SMA20 | 1.2766 |
| 1 | Daily SMA50 | 1.2788 |
| 2 | Daily SMA100 | 1.2628 |
| 3 | Daily SMA200 | 1.2379 |
The previous day high was 1.2766 while the previous day low was 1.2689. The daily 38.2% Fib levels comes at 1.2719, expected to provide support. Similarly, the daily 61.8% fib level is at 1.2737, expected to provide support.
Note the levels of interest below:
- Pivot support is noted at 1.2693, 1.2653, 1.2616
- Pivot resistance is noted at 1.277, 1.2807, 1.2847
| Levels | Levels.1 |
|---|---|
| Previous Daily High | 1.2766 |
| Previous Daily Low | 1.2689 |
| Previous Weekly High | 1.2788 |
| Previous Weekly Low | 1.2617 |
| Previous Monthly High | 1.3142 |
| Previous Monthly Low | 1.2659 |
| Daily Fibonacci 38.2% | 1.2719 |
| Daily Fibonacci 61.8% | 1.2737 |
| Daily Pivot Point S1 | 1.2693 |
| Daily Pivot Point S2 | 1.2653 |
| Daily Pivot Point S3 | 1.2616 |
| Daily Pivot Point R1 | 1.2770 |
| Daily Pivot Point R2 | 1.2807 |
| Daily Pivot Point R3 | 1.2847 |
[/s2If]
Download Nehcap EAWe have two EAs that are operational on our LIVE accounts.
- EA-FIX: Check out the details here. Download EA-FIX . EA-FIX is a non-grid HFT scalper.
- EA-GROWTH: High quality low dd EA using trend grids. Download EA_GROWTHJoin Our Telegram Group
")


