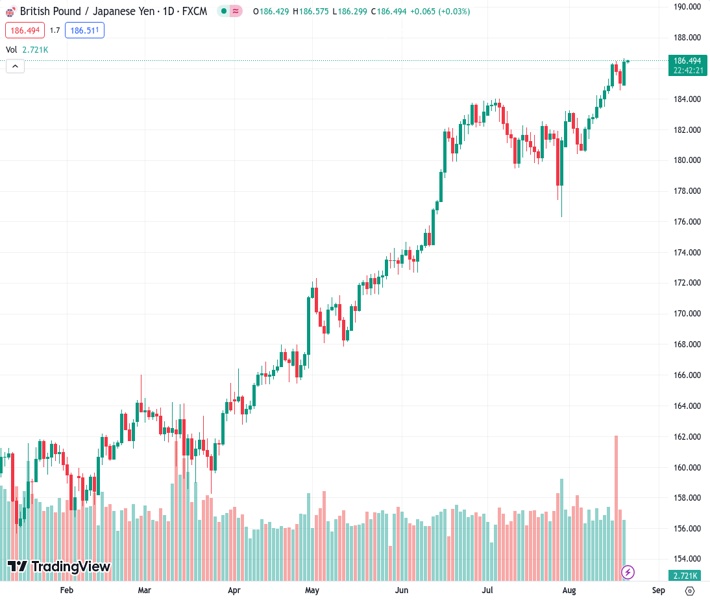
The GBPJPY rate finished close to 186.50, which is its highest level since November 2015.
…
This is a premium post.
[s2If !current_user_can(access_s2member_level4)]Please register for FREE REGISTER to read full post below containing analysis. In case of any error or you think you are not able to read the full post below, please email us at support#nehcap.com [lwa][/s2If] [s2If current_user_can(access_s2member_level1)]
- GBP/JPY closed near 186.50, its highest since November 2015.
The pair currently trades last at 186.491.
The previous day high was 185.94 while the previous day low was 184.56. The daily 38.2% Fib levels comes at 185.09, expected to provide support. Similarly, the daily 61.8% fib level is at 185.41, expected to provide support.
At the start of the week, the GBP/JPY cross leapt towards 186.50 as the GBP continued to trade strong agains the JPY, driven by hawkish bets on the Bank of Japan. Last week the UK reported hot inflation and wage figures from July, which made markets discount a terminal rate of 6% vs 5.75% at the start of the week, which made the GBP close the week as a top performer.
On the other hand, reports suggest that the Bank of Japan (BoJ) will only consider tightening as long as local wage and inflation figures meet their forecasts and dovish bets on the BoJ weaken the Yen. In addition, the fragile economic situation in China is also driving the JPY downwards, as it is one of Japan’s largest trading partners.
According to the daily chart analysis, short-term prospects for GBP/JPY look bullish. Both Relative Strength Index (RSI) and Moving Average Convergence Divergence (MACD) remain positive, implying a strengthening bullish momentum. Also, the pair is above the 20,100,200-day SMAs, highlighting the continued dominance of bulls on the broader scale.
Support levels: 186.00, 185.50, 185.00.
Resistance levels: 187.00, 187.50, 188.00.
Technical Levels: Supports and Resistances
GBPJPY currently trading at 186.52 at the time of writing. Pair opened at 185.12 and is trading with a change of 0.76 % .
| Overview | Overview.1 | |
|---|---|---|
| 0 | Today last price | 186.52 |
| 1 | Today Daily Change | 1.40 |
| 2 | Today Daily Change % | 0.76 |
| 3 | Today daily open | 185.12 |
The pair remains strongly bullish on the daily timeframe. It trades above its 20 SMA @ 182.83, 50 SMA 181.97, 100 SMA @ 175.8 and 200 SMA @ 169.08.
| Trends | Trends.1 | |
|---|---|---|
| 0 | Daily SMA20 | 182.83 |
| 1 | Daily SMA50 | 181.97 |
| 2 | Daily SMA100 | 175.80 |
| 3 | Daily SMA200 | 169.08 |
The previous day high was 185.94 while the previous day low was 184.56. The daily 38.2% Fib levels comes at 185.09, expected to provide support. Similarly, the daily 61.8% fib level is at 185.41, expected to provide support.
Note the levels of interest below:
- Pivot support is noted at 184.47, 183.82, 183.09
- Pivot resistance is noted at 185.86, 186.59, 187.24
| Levels | Levels.1 |
|---|---|
| Previous Daily High | 185.94 |
| Previous Daily Low | 184.56 |
| Previous Weekly High | 186.47 |
| Previous Weekly Low | 183.46 |
| Previous Monthly High | 184.02 |
| Previous Monthly Low | 176.32 |
| Daily Fibonacci 38.2% | 185.09 |
| Daily Fibonacci 61.8% | 185.41 |
| Daily Pivot Point S1 | 184.47 |
| Daily Pivot Point S2 | 183.82 |
| Daily Pivot Point S3 | 183.09 |
| Daily Pivot Point R1 | 185.86 |
| Daily Pivot Point R2 | 186.59 |
| Daily Pivot Point R3 | 187.24 |
[/s2If]
Download Nehcap EAWe have two EAs that are operational on our LIVE accounts.
- EA-FIX: Check out the details here. Download EA-FIX . EA-FIX is a non-grid HFT scalper.
- EA-GROWTH: High quality low dd EA using trend grids. Download EA_GROWTHJoin Our Telegram Group
")


