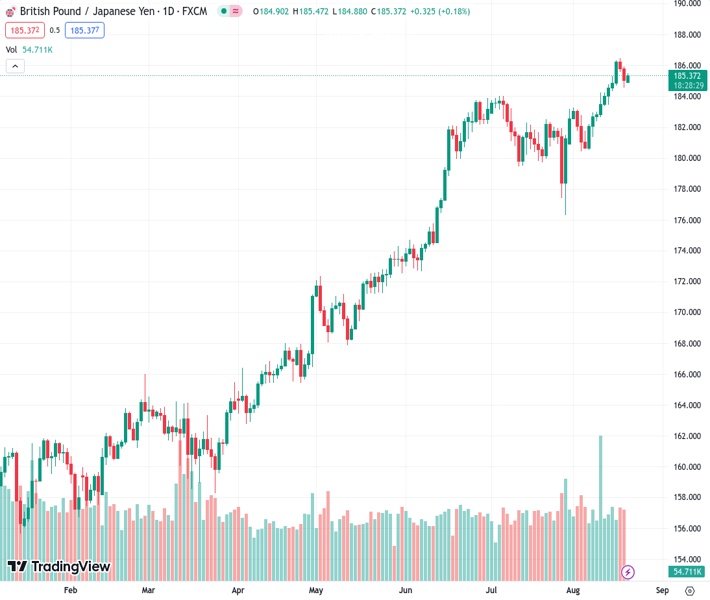
The GBPJPY currency pair has reached a new high of 185.375, marking its highest point of the day. This comes after three consecutive days of negative performance, making today the first day of positive movement. Analysts predict that there is potential for even more upward movement in the future.
…
This is a premium post.
[s2If !current_user_can(access_s2member_level4)]Please register for FREE REGISTER to read full post below containing analysis. In case of any error or you think you are not able to read the full post below, please email us at support#nehcap.com [lwa][/s2If] [s2If current_user_can(access_s2member_level1)]
- GBP/JPY renews intraday high during the first positive daily performance in three.
The pair currently trades last at 185.375.
The previous day high was 185.94 while the previous day low was 184.56. The daily 38.2% Fib levels comes at 185.09, expected to provide support. Similarly, the daily 61.8% fib level is at 185.41, expected to provide resistance.
GBP/JPY picks up bids to refresh intraday high near 185.45 as bulls attack the 100-Hour Moving Average (HMA) during the first positive day in three amid early Monday. In doing so, the cross-currency pair extends the previous day’s rebound from a one-week-old horizontal support area to poke the key moving average.
Adding strength to the bullish bias are the upbeat MACD signals and the RSI (14) line, which in turn suggests the quote’s further upside past the immediate 100-HMA hurdle of around 185.50.
That said, the support-turned-resistance line from August 07, close to 186.10 at the latest, acts as the final defense of the GBP/JPY bears.
Following that, the pair’s uptrend towards challenging the multi-year high marked the last week around 186.50, as well as the November 2015 high of 188.40, can’t be ruled out.
On the flip side, a clear break of the aforementioned horizontal support zone of around 184.70-60, becomes necessary for the intraday sellers.
Even so, the 200-HMA support of around 184.45 and the double tops marked on August 10–11 near 184.25-20, could challenge the GBP/JPY bears.
In a case where the quote remains bearish past 184.20, the 184.00 round figure and the monthly low of around 180.60 will be in the spotlight.
Trend: Further upside expected
Technical Levels: Supports and Resistances
GBPJPY currently trading at 185.43 at the time of writing. Pair opened at 185.12 and is trading with a change of 0.17% % .
| Overview | Overview.1 | |
|---|---|---|
| 0 | Today last price | 185.43 |
| 1 | Today Daily Change | 0.31 |
| 2 | Today Daily Change % | 0.17% |
| 3 | Today daily open | 185.12 |
The pair remains strongly bullish on the daily timeframe. It trades above its 20 SMA @ 182.83, 50 SMA 181.97, 100 SMA @ 175.8 and 200 SMA @ 169.08.
| Trends | Trends.1 | |
|---|---|---|
| 0 | Daily SMA20 | 182.83 |
| 1 | Daily SMA50 | 181.97 |
| 2 | Daily SMA100 | 175.80 |
| 3 | Daily SMA200 | 169.08 |
The previous day high was 185.94 while the previous day low was 184.56. The daily 38.2% Fib levels comes at 185.09, expected to provide support. Similarly, the daily 61.8% fib level is at 185.41, expected to provide resistance.
Note the levels of interest below:
- Pivot support is noted at 184.47, 183.82, 183.09
- Pivot resistance is noted at 185.86, 186.59, 187.24
| Levels | Levels.1 |
|---|---|
| Previous Daily High | 185.94 |
| Previous Daily Low | 184.56 |
| Previous Weekly High | 186.47 |
| Previous Weekly Low | 183.46 |
| Previous Monthly High | 184.02 |
| Previous Monthly Low | 176.32 |
| Daily Fibonacci 38.2% | 185.09 |
| Daily Fibonacci 61.8% | 185.41 |
| Daily Pivot Point S1 | 184.47 |
| Daily Pivot Point S2 | 183.82 |
| Daily Pivot Point S3 | 183.09 |
| Daily Pivot Point R1 | 185.86 |
| Daily Pivot Point R2 | 186.59 |
| Daily Pivot Point R3 | 187.24 |
[/s2If]
Download Nehcap EAWe have two EAs that are operational on our LIVE accounts.
- EA-FIX: Check out the details here. Download EA-FIX . EA-FIX is a non-grid HFT scalper.
- EA-GROWTH: High quality low dd EA using trend grids. Download EA_GROWTHJoin Our Telegram Group
")


