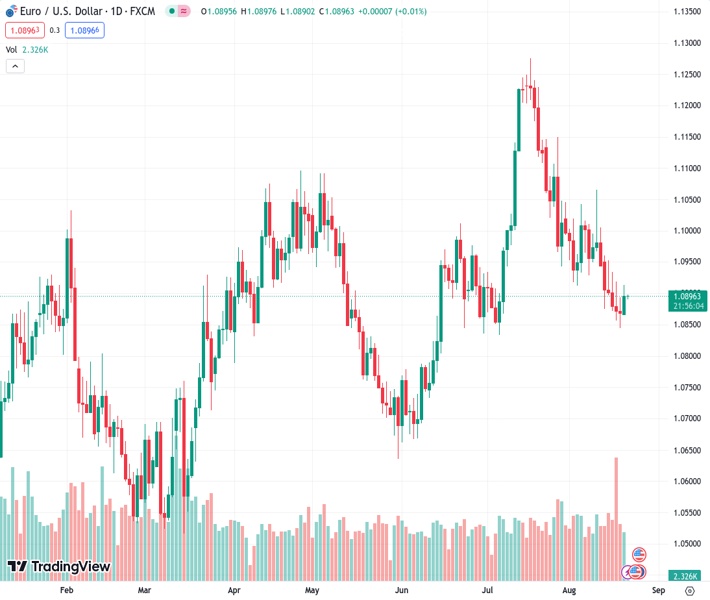
The EURUSD pair has increased in value after hitting a six-week low, experiencing its largest daily gains in two weeks.
…
This is a premium post.
[s2If !current_user_can(access_s2member_level4)]Please register for FREE REGISTER to read full post below containing analysis. In case of any error or you think you are not able to read the full post below, please email us at support#nehcap.com [lwa][/s2If] [s2If current_user_can(access_s2member_level1)]
- EUR/USD edges higher after bouncing off six-week low with the biggest daily gains in a fortnight.
The pair currently trades last at 1.08961.
The previous day high was 1.0894 while the previous day low was 1.0845. The daily 38.2% Fib levels comes at 1.0864, expected to provide support. Similarly, the daily 61.8% fib level is at 1.0875, expected to provide support.
EUR/USD holds onto the week-start corrective bounce while edging higher to 1.0900 amid Tuesday’s Asian session as the US Dollar fails to cheer upbeat yields and expectations of higher wages.
Euro rose the most in two weeks the previous day while extending the late Friday’s rebound from the lowest level since early July as the US Dollar Index (DXY) dropped despite the 15-year high US Treasury bond yields. In doing so, the major currency pair also ignored downbeat German Producer Price Index (PPI) data and the recently upbeat expectations of witnessing higher wages in the US. The reason could be linked to the market’s anxiety ahead of this week’s top-tier central bankers’ speeches at the Jackson Hole Symposium.
On Monday, German Producer Price Index (PPI) for July dropped to -1.1% MoM and -6.0% YoY from -0.3% prior and 0.1% YoY respectively priors. Following the data, Germany’s Bundesbank released its monthly report stating that the inflation could persist above the central bank’s target for longer while the German growth may remain flat in the third quarter (Q3) of 2023.
Recently, the Federal Reserve Bank of New York’s unveiled its SCE Labor Market Survey results suggesting record wage expectations. “The Lowest wage respondents would be willing to accept for a new job jumped to a record high of $78,645 in July, up from $72.873 a year ago,” said the findings.
Amid these plays, Wall Street closed mixed but the US 10-year Treasury bond yields rose to the highest level since 2007, to around 4.354% before ending Monday’s trading day near 4.34%.
Apart from the pre-Jackson Hole consolidation, the EUR/USD traders should have also justified China’s efforts to defend the post-COVID economic recovery via a slew of stimulus measures, as well as the receding recession fears in the bloc.
Looking forward, the US Existing Home Sales for July and Richmond Fed Manufacturing Index for August will join speeches from the mid-ties Federal Reserve (Fed) officials, not to forget the Eurozone Current Account for June, to entertain EUR/USD traders. However, major attention will be given to Friday’s Fed Chair Jerome Powell’s speech at the Jackson Hole Symposium amid indecision about the US central bank’s next moves.
A daily closing beyond the 100-DMA resistance of around 1.0930 becomes necessary for the EUR/USD buyers to retake control.
Technical Levels: Supports and Resistances
EURUSD currently trading at 1.0897 at the time of writing. Pair opened at 1.0872 and is trading with a change of 0.23 % .
| Overview | Overview.1 | |
|---|---|---|
| 0 | Today last price | 1.0897 |
| 1 | Today Daily Change | 0.0025 |
| 2 | Today Daily Change % | 0.2300 |
| 3 | Today daily open | 1.0872 |
The pair is trading below its 20 Daily moving average @ 1.0969, below its 50 Daily moving average @ 1.0978 , below its 100 Daily moving average @ 1.0931 and above its 200 Daily moving average @ 1.0791
| Trends | Trends.1 | |
|---|---|---|
| 0 | Daily SMA20 | 1.0969 |
| 1 | Daily SMA50 | 1.0978 |
| 2 | Daily SMA100 | 1.0931 |
| 3 | Daily SMA200 | 1.0791 |
The previous day high was 1.0894 while the previous day low was 1.0845. The daily 38.2% Fib levels comes at 1.0864, expected to provide support. Similarly, the daily 61.8% fib level is at 1.0875, expected to provide support.
Note the levels of interest below:
- Pivot support is noted at 1.0846, 1.0821, 1.0798
- Pivot resistance is noted at 1.0895, 1.0919, 1.0944
| Levels | Levels.1 |
|---|---|
| Previous Daily High | 1.0894 |
| Previous Daily Low | 1.0845 |
| Previous Weekly High | 1.0960 |
| Previous Weekly Low | 1.0845 |
| Previous Monthly High | 1.1276 |
| Previous Monthly Low | 1.0834 |
| Daily Fibonacci 38.2% | 1.0864 |
| Daily Fibonacci 61.8% | 1.0875 |
| Daily Pivot Point S1 | 1.0846 |
| Daily Pivot Point S2 | 1.0821 |
| Daily Pivot Point S3 | 1.0798 |
| Daily Pivot Point R1 | 1.0895 |
| Daily Pivot Point R2 | 1.0919 |
| Daily Pivot Point R3 | 1.0944 |
[/s2If]
Download Nehcap EAWe have two EAs that are operational on our LIVE accounts.
- EA-FIX: Check out the details here. Download EA-FIX . EA-FIX is a non-grid HFT scalper.
- EA-GROWTH: High quality low dd EA using trend grids. Download EA_GROWTHJoin Our Telegram Group
")


