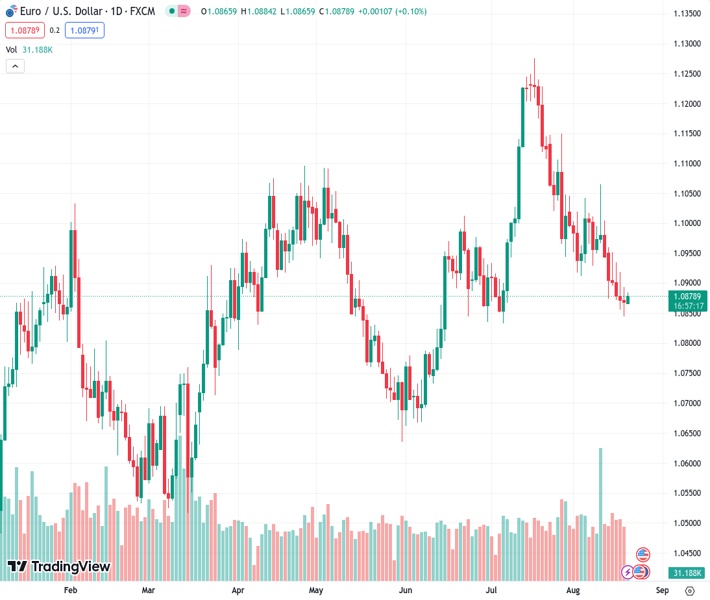
The EURUSD currency pair, trading at 1.08800, has received buying interest to continue its rebound from a low point seen six weeks ago. According to the perspective of @nehcap, there is not believed to be much potential for a significant recovery.
…
This is a premium post.
[s2If !current_user_can(access_s2member_level4)]Please register for FREE REGISTER to read full post below containing analysis. In case of any error or you think you are not able to read the full post below, please email us at support#nehcap.com [lwa][/s2If] [s2If current_user_can(access_s2member_level1)]
- EUR/USD picks up bids to extend recovery from six-week low.
The pair currently trades last at 1.08800.
The previous day high was 1.0894 while the previous day low was 1.0845. The daily 38.2% Fib levels comes at 1.0864, expected to provide support. Similarly, the daily 61.8% fib level is at 1.0875, expected to provide support.
EUR/USD clings to mild gains around 1.0880 as it defends the week-start rebound from the lowest level in six weeks amid mixed concerns in the market. That said, the Euro pair’s latest recovery could be linked to the consolidation of the previous five-week downtrend, as well as positioning for the August month Purchasing Managers Indexes (PMIs) and the Kansas Fed’s annual event for central bankers, namely the Jackson Hole Symposium.
Also read: EUR/USD Weekly Forecast: US Dollar to keep strengthening
Technically, Friday’s Doji candlestick joins the nearly oversold RSI (14) line to trigger the corrective bounce in the EUR/USD price.
However, a convergence of the 100-day Exponential Moving Average (EMA) joins a downward-sloping resistance line from July 19 to highlight the 1.0900 level as a tough nut to crack for the Euro pair buyers.
Following that, a one-month-old descending trend line surrounding 1.0980 will act as the final defense of the EUR/USD bears.
On the contrary, a horizontal area comprising multiple levels marked since April 10, around 1.0840 at the latest, restricts the immediate downside of the EUR/USD pair.
A daily closing beneath 1.0840, however, isn’t an open invitation to the Euro bears as the 200-day EMA and an ascending trend line from mid-March, close to 1.0800 at the latest, could challenge the quote’s further downside.
Overall, EUR/USD remains on the bear’s radar despite the latest rebound. The pair’s downside room, however, appears limited.
Trend: Limited recovery expected
Technical Levels: Supports and Resistances
EURUSD currently trading at 1.0882 at the time of writing. Pair opened at 1.0872 and is trading with a change of 0.09% % .
| Overview | Overview.1 | |
|---|---|---|
| 0 | Today last price | 1.0882 |
| 1 | Today Daily Change | 0.0010 |
| 2 | Today Daily Change % | 0.09% |
| 3 | Today daily open | 1.0872 |
The pair is trading below its 20 Daily moving average @ 1.0969, below its 50 Daily moving average @ 1.0978 , below its 100 Daily moving average @ 1.0931 and above its 200 Daily moving average @ 1.0791
| Trends | Trends.1 | |
|---|---|---|
| 0 | Daily SMA20 | 1.0969 |
| 1 | Daily SMA50 | 1.0978 |
| 2 | Daily SMA100 | 1.0931 |
| 3 | Daily SMA200 | 1.0791 |
The previous day high was 1.0894 while the previous day low was 1.0845. The daily 38.2% Fib levels comes at 1.0864, expected to provide support. Similarly, the daily 61.8% fib level is at 1.0875, expected to provide support.
Note the levels of interest below:
- Pivot support is noted at 1.0846, 1.0821, 1.0798
- Pivot resistance is noted at 1.0895, 1.0919, 1.0944
| Levels | Levels.1 |
|---|---|
| Previous Daily High | 1.0894 |
| Previous Daily Low | 1.0845 |
| Previous Weekly High | 1.0960 |
| Previous Weekly Low | 1.0845 |
| Previous Monthly High | 1.1276 |
| Previous Monthly Low | 1.0834 |
| Daily Fibonacci 38.2% | 1.0864 |
| Daily Fibonacci 61.8% | 1.0875 |
| Daily Pivot Point S1 | 1.0846 |
| Daily Pivot Point S2 | 1.0821 |
| Daily Pivot Point S3 | 1.0798 |
| Daily Pivot Point R1 | 1.0895 |
| Daily Pivot Point R2 | 1.0919 |
| Daily Pivot Point R3 | 1.0944 |
[/s2If]
Download Nehcap EAWe have two EAs that are operational on our LIVE accounts.
- EA-FIX: Check out the details here. Download EA-FIX . EA-FIX is a non-grid HFT scalper.
- EA-GROWTH: High quality low dd EA using trend grids. Download EA_GROWTHJoin Our Telegram Group
")


