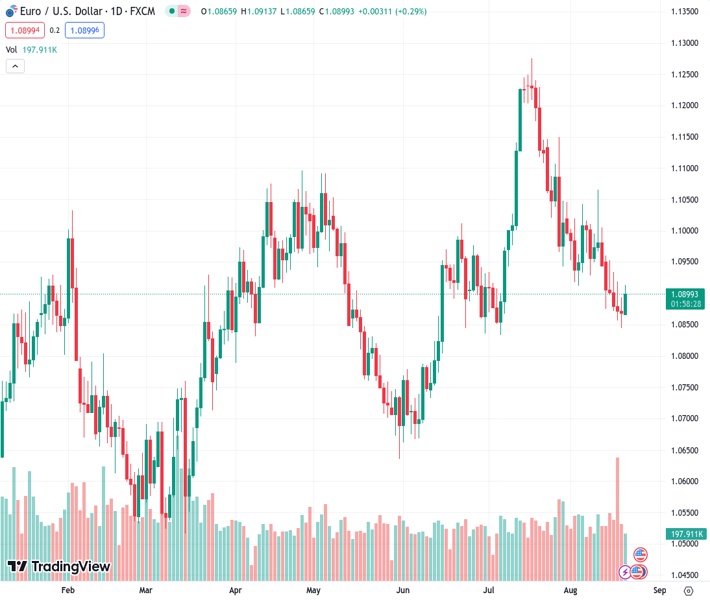
The Euro to US Dollar exchange rate has rebounded following a string of six days of declines and is currently hovering near the 1.0900 level.
…
This is a premium post.
[s2If !current_user_can(access_s2member_level4)]Please register for FREE REGISTER to read full post below containing analysis. In case of any error or you think you are not able to read the full post below, please email us at support#nehcap.com [lwa][/s2If] [s2If current_user_can(access_s2member_level1)]
- The EUR/USD gained traction after six consecutive days of losses and trades around the 1.0900 zone.
The pair currently trades last at 1.08986.
The previous day high was 1.0894 while the previous day low was 1.0845. The daily 38.2% Fib levels comes at 1.0864, expected to provide support. Similarly, the daily 61.8% fib level is at 1.0875, expected to provide support.
At the start of the week, the EUR/USD is gaining traction after six consecutive days of losses, trading near 1.0900. The German Buba Monthly Report showed risk inflation which fueled a rise in German yields on hawkish bets on the European Central Bank (ECB). Additionally, investors await the Jackson Hole Symposium on Thursday, in were Jerome Powell and Christine Lagarde will probably give clues for further guidance on their respective monetary policies.
The German Buba Monthly Report showed that inflation could persist above the central bank’s targets for longer. In that sense, upside inflation risks made investors place hawkish bets on the European Central Bank (ECB), causing the German bonds for 2,5 and 10-year yields to rise to 3.10%, 2.70% and 2.70%, respectively. Additionally, the World Interest Rate Probability (WIRP) indicates that the markets are betting on 55% odds of a 25 basis point (bps) hike in the September 14 meeting, while those odds rise to 75% and 85% for the October and December meetings. In that sense, those hawkish bets make the Euro gain interest against its rivals.
For the US side, the USD measured by the DXY index is trading flat as investors await S&P PMI data on Wednesday and Jerome Powell’s speech at Jackson Hole Symposium, where investors will look for clues regarding forward guidance. As for now, markets are discounting that the Federal Reserve (Fed) won’t hike in September and nearly 40% probability of a 25 basis point (bps) hike in November.
Observing the daily chart, the outlook remains neutral to bearish for the EUR/USD. With a positive slope below its midline, the Relative Strength Index (RSI) signals a strengthening bullish sentiment, while the Moving Average Convergence (MACD) prints shorter red bars. Additionally, the pair is below the 20 and 100-day Simple Moving Averages (SMAs) but above the 200-day SMA, indicating that the bulls aren’t done yet and that the outlook is still positive for the short term.
Support levels: 1.0850, 1.0830, 1.0793 (200-day SMA)
Resistance levels: 1.0960 (20-day SMA), 1.0970, 1.0980.
Technical Levels: Supports and Resistances
EURUSD currently trading at 1.0899 at the time of writing. Pair opened at 1.0872 and is trading with a change of 0.25 % .
| Overview | Overview.1 | |
|---|---|---|
| 0 | Today last price | 1.0899 |
| 1 | Today Daily Change | 0.0027 |
| 2 | Today Daily Change % | 0.2500 |
| 3 | Today daily open | 1.0872 |
The pair is trading below its 20 Daily moving average @ 1.0969, below its 50 Daily moving average @ 1.0978 , below its 100 Daily moving average @ 1.0931 and above its 200 Daily moving average @ 1.0791
| Trends | Trends.1 | |
|---|---|---|
| 0 | Daily SMA20 | 1.0969 |
| 1 | Daily SMA50 | 1.0978 |
| 2 | Daily SMA100 | 1.0931 |
| 3 | Daily SMA200 | 1.0791 |
The previous day high was 1.0894 while the previous day low was 1.0845. The daily 38.2% Fib levels comes at 1.0864, expected to provide support. Similarly, the daily 61.8% fib level is at 1.0875, expected to provide support.
Note the levels of interest below:
- Pivot support is noted at 1.0846, 1.0821, 1.0798
- Pivot resistance is noted at 1.0895, 1.0919, 1.0944
| Levels | Levels.1 |
|---|---|
| Previous Daily High | 1.0894 |
| Previous Daily Low | 1.0845 |
| Previous Weekly High | 1.0960 |
| Previous Weekly Low | 1.0845 |
| Previous Monthly High | 1.1276 |
| Previous Monthly Low | 1.0834 |
| Daily Fibonacci 38.2% | 1.0864 |
| Daily Fibonacci 61.8% | 1.0875 |
| Daily Pivot Point S1 | 1.0846 |
| Daily Pivot Point S2 | 1.0821 |
| Daily Pivot Point S3 | 1.0798 |
| Daily Pivot Point R1 | 1.0895 |
| Daily Pivot Point R2 | 1.0919 |
| Daily Pivot Point R3 | 1.0944 |
[/s2If]
Download Nehcap EAWe have two EAs that are operational on our LIVE accounts.
- EA-FIX: Check out the details here. Download EA-FIX . EA-FIX is a non-grid HFT scalper.
- EA-GROWTH: High quality low dd EA using trend grids. Download EA_GROWTHJoin Our Telegram Group
")


