Silver has been able to attract buyers for the third day in a row, but there is a lack of strong bullish sentiment.
…
This is a premium post.
[s2If !current_user_can(access_s2member_level4)]Please register for FREE REGISTER to read full post below containing analysis. In case of any error or you think you are not able to read the full post below, please email us at support#nehcap.com [lwa][/s2If] [s2If current_user_can(access_s2member_level1)]
- Silver attracts some buyers for the third successive day, though lacks bullish conviction.
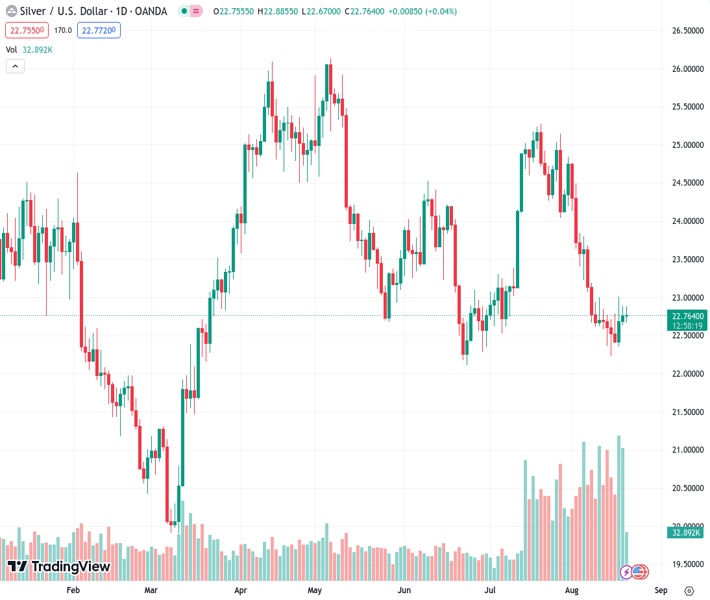
The pair currently trades last at 22.760.
The previous day high was 22.89 while the previous day low was 22.64. The daily 38.2% Fib levels comes at 22.79, expected to provide resistance. Similarly, the daily 61.8% fib level is at 22.73, expected to provide support.
Silver trades with a positive bias for the third successive day on Monday, albeit lacks any follow-through buying and remains confined in a familiar range below the $23.00 mark through the early European session. The intraday technical setup, meanwhile, favours bullish traders and supports prospects for additional gains.
The outlook is reinforced by the fact that the XAG/USD is holding above the $22.70-$22.65 confluence, comprising the 200-hour and the 100-hour Simple Moving Averages (SMAs). This, along with positive technical indicators on the hourly charts, suggests that the path of least resistance for the white metal is to the upside. That said, oscillators on the daily chart – though have been recovering – are yet to confirm the positive outlook and warrant some caution for bulls.
Hence, any subsequent strength back above the $23.00 mark is more likely to confront a stiff barrier near the very important 200-day SMA, currently pegged around the $23.25 region. This is closely followed by resistance near the $23.60-$23.60 horizontal zone, above which a fresh bout of a short-covering has the potential to lift the XAG/USD towards the $24.00 round figure. The latter coincides with the 100-day SMA and should act as a pivotal point for short-term traders.
On the flip side, a sustained break below the aforementioned $22.70-$22.65 confluence support might prompt some technical selling and expose the multi-month low, around the $22.10 region touched in June. Some follow-through selling below the $22.00 mark will be seen as a fresh trigger for bearish traders. The XAG/USD might then accelerate the slide towards the $21.55-$21.50 area en route to the $21.00 round figure. The next relevant support is pegged near the $20.60 area, below which the downward trajectory could get extended towards challenging the $20.00 psychological mark.
Technical Levels: Supports and Resistances
XAGUSD currently trading at 22.8 at the time of writing. Pair opened at 22.77 and is trading with a change of 0.13 % .
| Overview | Overview.1 | |
|---|---|---|
| 0 | Today last price | 22.80 |
| 1 | Today Daily Change | 0.03 |
| 2 | Today Daily Change % | 0.13 |
| 3 | Today daily open | 22.77 |
The pair remains strongly bearish on the daily time frame. It trades below the 20 SMA @ 23.47, 50 SMA 23.53, 100 SMA @ 24.01 and 200 SMA @ 23.29.
| Trends | Trends.1 | |
|---|---|---|
| 0 | Daily SMA20 | 23.47 |
| 1 | Daily SMA50 | 23.53 |
| 2 | Daily SMA100 | 24.01 |
| 3 | Daily SMA200 | 23.29 |
The previous day high was 22.89 while the previous day low was 22.64. The daily 38.2% Fib levels comes at 22.79, expected to provide resistance. Similarly, the daily 61.8% fib level is at 22.73, expected to provide support.
Note the levels of interest below:
- Pivot support is noted at 22.64, 22.51, 22.39
- Pivot resistance is noted at 22.89, 23.02, 23.15
| Levels | Levels.1 |
|---|---|
| Previous Daily High | 22.89 |
| Previous Daily Low | 22.64 |
| Previous Weekly High | 23.01 |
| Previous Weekly Low | 22.23 |
| Previous Monthly High | 25.27 |
| Previous Monthly Low | 22.52 |
| Daily Fibonacci 38.2% | 22.79 |
| Daily Fibonacci 61.8% | 22.73 |
| Daily Pivot Point S1 | 22.64 |
| Daily Pivot Point S2 | 22.51 |
| Daily Pivot Point S3 | 22.39 |
| Daily Pivot Point R1 | 22.89 |
| Daily Pivot Point R2 | 23.02 |
| Daily Pivot Point R3 | 23.15 |
[/s2If]
Download Nehcap EAWe have two EAs that are operational on our LIVE accounts.
- EA-FIX: Check out the details here. Download EA-FIX . EA-FIX is a non-grid HFT scalper.
- EA-GROWTH: High quality low dd EA using trend grids. Download EA_GROWTHJoin Our Telegram Group
")


