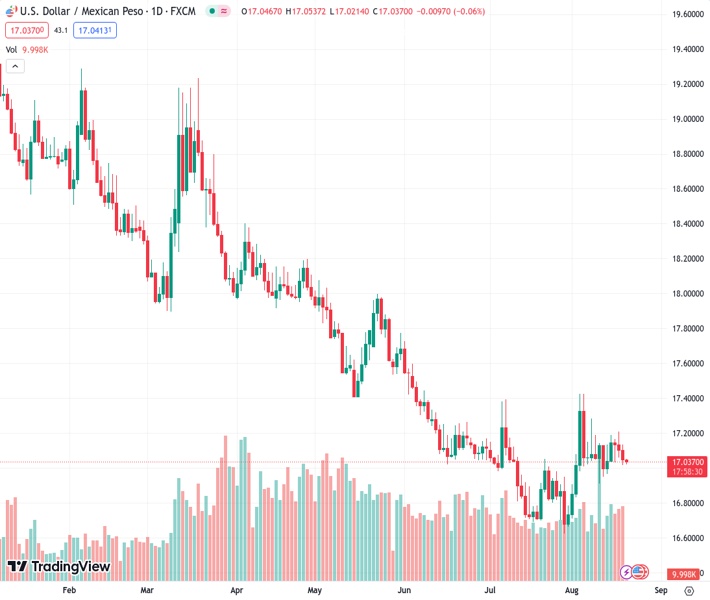
On the first day of the week, the USDMXN currency pair is observed fluctuating within a small range of trading at a value of 17.0412.
…
This is a premium post.
[s2If !current_user_can(access_s2member_level4)]Please register for FREE REGISTER to read full post below containing analysis. In case of any error or you think you are not able to read the full post below, please email us at support#nehcap.com [lwa][/s2If] [s2If current_user_can(access_s2member_level1)]
- USD/MXN is seen oscillating in a narrow trading band on the first day of a new week.
The pair currently trades last at 17.0412.
The previous day high was 17.1366 while the previous day low was 17.0167. The daily 38.2% Fib levels comes at 17.0625, expected to provide resistance. Similarly, the daily 61.8% fib level is at 17.0908, expected to provide resistance.
The USD/MXN pair struggles to gain any meaningful traction on Monday and oscillates in a narrow band, around the 17.0500 area through the Asian session. The technical setup, meanwhile, seems tilted in favour of bearish traders and suggests that the path of least resistance for spot prices is to the downside.
Friday’s breakdown below the 17.0800-17.0850 confluence, comprising the 200-hour Simple Moving Average (SMA) and an ascending trend line extending from the August 10 swing low, validates the negative outlook for the USD/MXN pair. Moreover, oscillators on hourly charts have again started gaining negative traction and support prospects for some meaningful intraday downfall. That said, neutral technical indicators on the daily chart warrant some caution before placing aggressive bearish bets.
Hence, any subsequent slide is more likely to find some support near Friday’s low, around the 17.0165 region ahead of the 17.0000 psychological mark. A convincing break below the latter will reaffirm the bearish bias and drag the USD/MXN pair towards the 16.8200-16.7995 area en route to the next relevant support near the 16.7030-16.7025 region and the YTD trough, around the 16.6260-16.6255 zone touched in July.
On the flip side, the 200-hour SMA, currently pegged near the 17.0800 level, might now act as an immediate barrier ahead of the ascending trend-line support breakpoint, near the 17.1100 region. This is followed by the 17.1610-17.1615 supply zone and the 17.1900 barrier, above which a fresh bout of a short-covering could lift the USD/MXN towards the 17.2835 zone en route to the monthly peak, around the 17.4260 region. Some follow-through buying will be seen as a fresh trigger for bullish traders and pave the way for some meaningful appreciating move in the near term.
Technical Levels: Supports and Resistances
USDMXN currently trading at 17.0452 at the time of writing. Pair opened at 17.057 and is trading with a change of -0.07 % .
| Overview | Overview.1 | |
|---|---|---|
| 0 | Today last price | 17.0452 |
| 1 | Today Daily Change | -0.0118 |
| 2 | Today Daily Change % | -0.0700 |
| 3 | Today daily open | 17.0570 |
The pair is trading above its 20 Daily moving average @ 17.0056, above its 50 Daily moving average @ 17.0284 , below its 100 Daily moving average @ 17.4305 and below its 200 Daily moving average @ 18.1906
| Trends | Trends.1 | |
|---|---|---|
| 0 | Daily SMA20 | 17.0056 |
| 1 | Daily SMA50 | 17.0284 |
| 2 | Daily SMA100 | 17.4305 |
| 3 | Daily SMA200 | 18.1906 |
The previous day high was 17.1366 while the previous day low was 17.0167. The daily 38.2% Fib levels comes at 17.0625, expected to provide resistance. Similarly, the daily 61.8% fib level is at 17.0908, expected to provide resistance.
Note the levels of interest below:
- Pivot support is noted at 17.0036, 16.9502, 16.8837
- Pivot resistance is noted at 17.1235, 17.19, 17.2434
| Levels | Levels.1 |
|---|---|
| Previous Daily High | 17.1366 |
| Previous Daily Low | 17.0167 |
| Previous Weekly High | 17.2094 |
| Previous Weekly Low | 16.9663 |
| Previous Monthly High | 17.3957 |
| Previous Monthly Low | 16.6258 |
| Daily Fibonacci 38.2% | 17.0625 |
| Daily Fibonacci 61.8% | 17.0908 |
| Daily Pivot Point S1 | 17.0036 |
| Daily Pivot Point S2 | 16.9502 |
| Daily Pivot Point S3 | 16.8837 |
| Daily Pivot Point R1 | 17.1235 |
| Daily Pivot Point R2 | 17.1900 |
| Daily Pivot Point R3 | 17.2434 |
[/s2If]
Download Nehcap EAWe have two EAs that are operational on our LIVE accounts.
- EA-FIX: Check out the details here. Download EA-FIX . EA-FIX is a non-grid HFT scalper.
- EA-GROWTH: High quality low dd EA using trend grids. Download EA_GROWTHJoin Our Telegram Group
")


