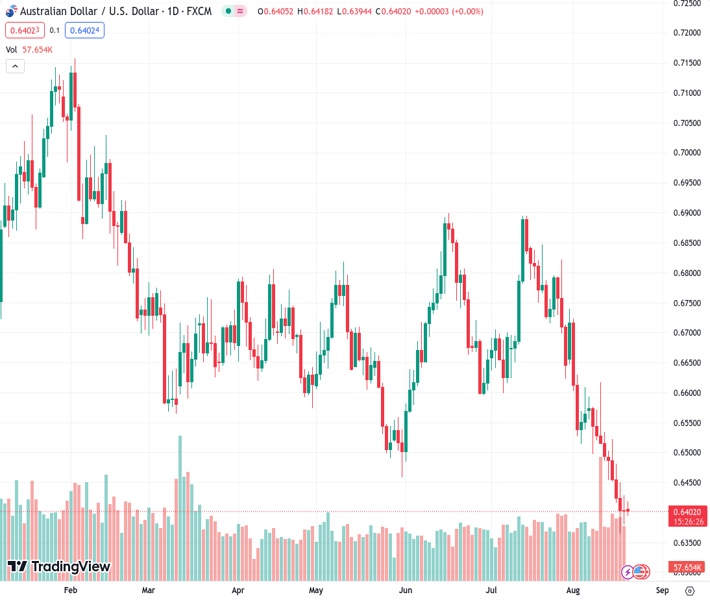
Bears are becoming more active in the AUDUSD pair at 0.64014 as recent US data demonstrates ongoing strength.
…
This is a premium post.
[s2If !current_user_can(access_s2member_level4)]Please register for FREE REGISTER to read full post below containing analysis. In case of any error or you think you are not able to read the full post below, please email us at support#nehcap.com [lwa][/s2If] [s2If current_user_can(access_s2member_level1)]
- AUD/USD bears are active after US data continues to show strength.
The pair currently trades last at 0.64014.
The previous day high was 0.6429 while the previous day low was 0.6379. The daily 38.2% Fib levels comes at 0.641, expected to provide resistance. Similarly, the daily 61.8% fib level is at 0.6398, expected to provide support.
AUD/USD struggles to hold ground from continuing the losing streak, hovering around 0.6400 during the Asian session on Monday. The AUD/USD pair is experiencing downward pressure due to improved employment and manufacturing survey data. Traders await Australia’s preliminary S&P Global Composite PMI scheduled to release later in the week, seeking fresh impetus on Australian economic activities.
The Moving Average Convergence Divergence (MACD) line indicates the selling bias in the pair as it stays in the negative territory of the centerline and shows divergence below the signal line. The monthly low at 0.6364 which was marked on Thursday, appears to be the immediate support. A collapse below the latter could push the pair to navigate the region around 0.6300 psychological level.
In the short-term view, the bearish sentiment of the AUD/USD pair remains unchanged until the 14-day Relative Strength Index (RSI) remains below 50.
On the upside, the seven-day Exponential Moving Average (EMA) at 0.6441 emerges to be a key barrier. A break above that level could provide support to the AUD/USD pair to explore around the 23.6% Fibonacci retracement at 0.6489, followed by the 0.6500 psychological level.
Technical Levels: Supports and Resistances
AUDUSD currently trading at 0.6403 at the time of writing. Pair opened at 0.6411 and is trading with a change of -0.12 % .
| Overview | Overview.1 | |
|---|---|---|
| 0 | Today last price | 0.6403 |
| 1 | Today Daily Change | -0.0008 |
| 2 | Today Daily Change % | -0.1200 |
| 3 | Today daily open | 0.6411 |
The pair remains strongly bearish on the daily time frame. It trades below the 20 SMA @ 0.6574, 50 SMA 0.6676, 100 SMA @ 0.6669 and 200 SMA @ 0.6734.
| Trends | Trends.1 | |
|---|---|---|
| 0 | Daily SMA20 | 0.6574 |
| 1 | Daily SMA50 | 0.6676 |
| 2 | Daily SMA100 | 0.6669 |
| 3 | Daily SMA200 | 0.6734 |
The previous day high was 0.6429 while the previous day low was 0.6379. The daily 38.2% Fib levels comes at 0.641, expected to provide resistance. Similarly, the daily 61.8% fib level is at 0.6398, expected to provide support.
Note the levels of interest below:
- Pivot support is noted at 0.6384, 0.6356, 0.6334
- Pivot resistance is noted at 0.6433, 0.6456, 0.6483
| Levels | Levels.1 |
|---|---|
| Previous Daily High | 0.6429 |
| Previous Daily Low | 0.6379 |
| Previous Weekly High | 0.6522 |
| Previous Weekly Low | 0.6364 |
| Previous Monthly High | 0.6895 |
| Previous Monthly Low | 0.6599 |
| Daily Fibonacci 38.2% | 0.6410 |
| Daily Fibonacci 61.8% | 0.6398 |
| Daily Pivot Point S1 | 0.6384 |
| Daily Pivot Point S2 | 0.6356 |
| Daily Pivot Point S3 | 0.6334 |
| Daily Pivot Point R1 | 0.6433 |
| Daily Pivot Point R2 | 0.6456 |
| Daily Pivot Point R3 | 0.6483 |
[/s2If]
Download Nehcap EAWe have two EAs that are operational on our LIVE accounts.
- EA-FIX: Check out the details here. Download EA-FIX . EA-FIX is a non-grid HFT scalper.
- EA-GROWTH: High quality low dd EA using trend grids. Download EA_GROWTHJoin Our Telegram Group
")


