The USDJPY pair recorded a series of consecutive losses at a rate of 145.291, however, it is still expected to achieve a gain for the week.
…
This is a premium post.
[s2If !current_user_can(access_s2member_level4)]Please register for FREE REGISTER to read full post below containing analysis. In case of any error or you think you are not able to read the full post below, please email us at support#nehcap.com [lwa][/s2If] [s2If current_user_can(access_s2member_level1)]
- USD/JPY tallied a consecutive day of losses, but it is still poised for a weekly gain.
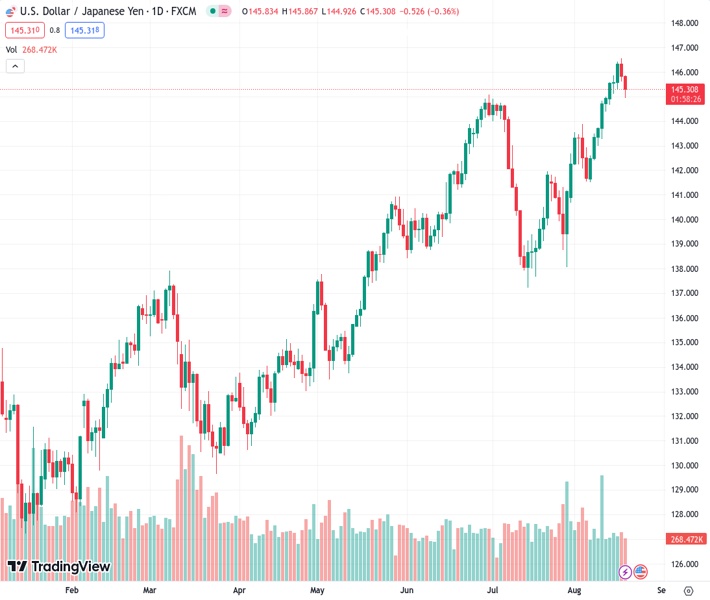
The pair currently trades last at 145.291.
The previous day high was 146.56 while the previous day low was 145.62. The daily 38.2% Fib levels comes at 145.98, expected to provide resistance. Similarly, the daily 61.8% fib level is at 146.2, expected to provide resistance.
In Friday’s session, the JPY was one of the top performers as it traded strongly against most of its rivals following the release of higher-than-expected inflation figures from July from Japan. On the other hand, the USD, measured by the DXY index, trades mild losses, after jumping to its highest level since mid-June, near 103.60.
Japan’s recent National Consumer Price Index (CPI) for July surpassed forecasts, coming in at 3.3% YoY, outperforming the anticipated 2.5% and aligning with the previous reading. This unexpected boost has propelled the JPY to a position of strength against many of its counterparts. However, given the overall economic fragility in the local economic activity, the reported inflation might not align with the Bank of Japan’s (BoJ) ideal conditions for a policy shift. Furthermore, the BoJ maintains a cautious stance as it closely monitors developments in China, refraining from adjusting to its accommodative approach.
On the US side, the Greenback benefited from risk-aversion due to the recent Chinese financial woes after the real state gigant Evergrande filed for bankruptcy protection in the US. In addition, the USD got a boost against its rivals during the week mainly because of the hawkish stance seen by the Federal Open Market Committee (FOMC) in Wednesday’s minutes from the July meeting, which saw participants not shutting the door for another hike in this cycle. Focus now shifts to next week’s S&P Global PMI indexes.
The daily chart shows bullish exhaustion for USD/JPY, contributing to a neutral, bearish technical stance. Both the Relative Strength Index (RSI) and Moving Average Convergence Divergence (MACD) exhibit indications of fading momentum. The RSI shows a downward trend above its midline, suggesting diminishing bullish strength, while the MACD lays out decreasing green bars. In addition, the pair is above the 20,100,200-day Simple Moving Averages (SMAs) on the bigger picture, implying that the bulls are in command over the sellers on a broader scale.
Support levels: 145.00, 144.00, 143.20 (20-day SMA).
Resistance levels: 145.50, 146.00, 146.30.
Technical Levels: Supports and Resistances
USDJPY currently trading at 145.21 at the time of writing. Pair opened at 145.84 and is trading with a change of -0.43 % .
| Overview | Overview.1 | |
|---|---|---|
| 0 | Today last price | 145.21 |
| 1 | Today Daily Change | -0.63 |
| 2 | Today Daily Change % | -0.43 |
| 3 | Today daily open | 145.84 |
The pair remains strongly bullish on the daily timeframe. It trades above its 20 SMA @ 143.05, 50 SMA 142.2, 100 SMA @ 139.06 and 200 SMA @ 136.5.
| Trends | Trends.1 | |
|---|---|---|
| 0 | Daily SMA20 | 143.05 |
| 1 | Daily SMA50 | 142.20 |
| 2 | Daily SMA100 | 139.06 |
| 3 | Daily SMA200 | 136.50 |
The previous day high was 146.56 while the previous day low was 145.62. The daily 38.2% Fib levels comes at 145.98, expected to provide resistance. Similarly, the daily 61.8% fib level is at 146.2, expected to provide resistance.
Note the levels of interest below:
- Pivot support is noted at 145.45, 145.06, 144.51
- Pivot resistance is noted at 146.39, 146.95, 147.34
| Levels | Levels.1 |
|---|---|
| Previous Daily High | 146.56 |
| Previous Daily Low | 145.62 |
| Previous Weekly High | 145.00 |
| Previous Weekly Low | 141.51 |
| Previous Monthly High | 144.91 |
| Previous Monthly Low | 137.24 |
| Daily Fibonacci 38.2% | 145.98 |
| Daily Fibonacci 61.8% | 146.20 |
| Daily Pivot Point S1 | 145.45 |
| Daily Pivot Point S2 | 145.06 |
| Daily Pivot Point S3 | 144.51 |
| Daily Pivot Point R1 | 146.39 |
| Daily Pivot Point R2 | 146.95 |
| Daily Pivot Point R3 | 147.34 |
[/s2If]
Download Nehcap EAWe have two EAs that are operational on our LIVE accounts.
- EA-FIX: Check out the details here. Download EA-FIX . EA-FIX is a non-grid HFT scalper.
- EA-GROWTH: High quality low dd EA using trend grids. Download EA_GROWTHJoin Our Telegram Group
")


