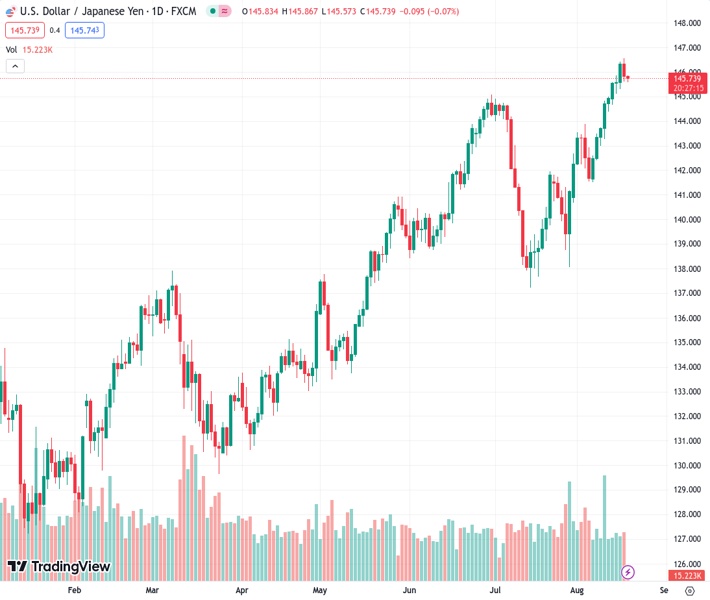
The USDJPY pair, currently at 145.744, has come down from its highest point of the year and remains below the 146.00 level on Friday.
…
This is a premium post.
[s2If !current_user_can(access_s2member_level4)]Please register for FREE REGISTER to read full post below containing analysis. In case of any error or you think you are not able to read the full post below, please email us at support#nehcap.com [lwa][/s2If] [s2If current_user_can(access_s2member_level1)]
- USD/JPY retreats from a YTD high and holds below the 146.00 mark on Friday.
The pair currently trades last at 145.744.
The previous day high was 146.56 while the previous day low was 145.62. The daily 38.2% Fib levels comes at 145.98, expected to provide resistance. Similarly, the daily 61.8% fib level is at 146.2, expected to provide resistance.
The USD/JPY pair consolidates its recent losses after retracing from a year-to-date (YTD) high of 146.56 during the early Asian session on Friday. The major pair currently trades around 145.74, down 0.07% on the day.
Japan’s Statistics Bureau reported on Friday that the Japanese National Consumer Price Index (CPI) for July YoY came in at 3.3% against the market expectation of 2.5%. Meanwhile, the National CPI ex Fresh Food YoY matched the market consensus of 3.1%, and the National CPI ex Food, Energy rose to 4.3% figures versus 4.2% prior.
On Thursday, Exports declined 0.3% YoY, the first drop in 29 months, with a significant decline in shipments to China. While Imports dipped 13.5%, versus the 14.7% decline expected. Meanwhile, the Japanese trade deficit totaled 78.7 billion yen versus the estimation of a 24.6 billion yen deficit.
On the US Dollar front, the number of jobless claims increased to 239K for the week ending on August 12. The figure came in slightly below the market expectation of 240K, the US Bureau of Labour Statistics (BLS) reported on Thursday. Meanwhile, the Continuing Jobless Claims increased to 1.716 million, the highest level seen in the last four weeks. Finally, the Philadelphia Federal Reserve’s Manufacturing Survey for August improved to 12, beating the expectation of -10 and the previous month of -12.
That said, the robust US labor data might convince the Federal Reserve (Fed) for an additional rate hike. FOMC Minutes emphasized that inflation remained unacceptably high and it may need additional tightening of monetary policy to bring inflation to the longer-run target.
The divergence of monetary policy between the US and Japan is the main driver of Yen’s weakening. However, the optimism that US interest rates have peaked might cap the upside in the Greenback. Furthermore, traders turn cautious amid the fear of FX intervention by the BoJ. It’s worth noting that the Japanese central bank prompted massive dollar selling in September and October last year as the Japanese Yen approached the 145 zone.
In the absence of economic data release from both Japan and the US, the USD/JPY pair remains at the mercy of USD price dynamics. In the meantime, market players will keep an eye on the headline surrounding China’s debt crisis and the real-estate woes, which could weigh on the risk sentiment.
Technical Levels: Supports and Resistances
USDJPY currently trading at 145.77 at the time of writing. Pair opened at 145.84 and is trading with a change of -0.05 % .
| Overview | Overview.1 | |
|---|---|---|
| 0 | Today last price | 145.77 |
| 1 | Today Daily Change | -0.07 |
| 2 | Today Daily Change % | -0.05 |
| 3 | Today daily open | 145.84 |
The pair remains strongly bullish on the daily timeframe. It trades above its 20 SMA @ 143.05, 50 SMA 142.2, 100 SMA @ 139.06 and 200 SMA @ 136.5.
| Trends | Trends.1 | |
|---|---|---|
| 0 | Daily SMA20 | 143.05 |
| 1 | Daily SMA50 | 142.20 |
| 2 | Daily SMA100 | 139.06 |
| 3 | Daily SMA200 | 136.50 |
The previous day high was 146.56 while the previous day low was 145.62. The daily 38.2% Fib levels comes at 145.98, expected to provide resistance. Similarly, the daily 61.8% fib level is at 146.2, expected to provide resistance.
Note the levels of interest below:
- Pivot support is noted at 145.45, 145.06, 144.51
- Pivot resistance is noted at 146.39, 146.95, 147.34
| Levels | Levels.1 |
|---|---|
| Previous Daily High | 146.56 |
| Previous Daily Low | 145.62 |
| Previous Weekly High | 145.00 |
| Previous Weekly Low | 141.51 |
| Previous Monthly High | 144.91 |
| Previous Monthly Low | 137.24 |
| Daily Fibonacci 38.2% | 145.98 |
| Daily Fibonacci 61.8% | 146.20 |
| Daily Pivot Point S1 | 145.45 |
| Daily Pivot Point S2 | 145.06 |
| Daily Pivot Point S3 | 144.51 |
| Daily Pivot Point R1 | 146.39 |
| Daily Pivot Point R2 | 146.95 |
| Daily Pivot Point R3 | 147.34 |
[/s2If]
Download Nehcap EAWe have two EAs that are operational on our LIVE accounts.
- EA-FIX: Check out the details here. Download EA-FIX . EA-FIX is a non-grid HFT scalper.
- EA-GROWTH: High quality low dd EA using trend grids. Download EA_GROWTHJoin Our Telegram Group
")


