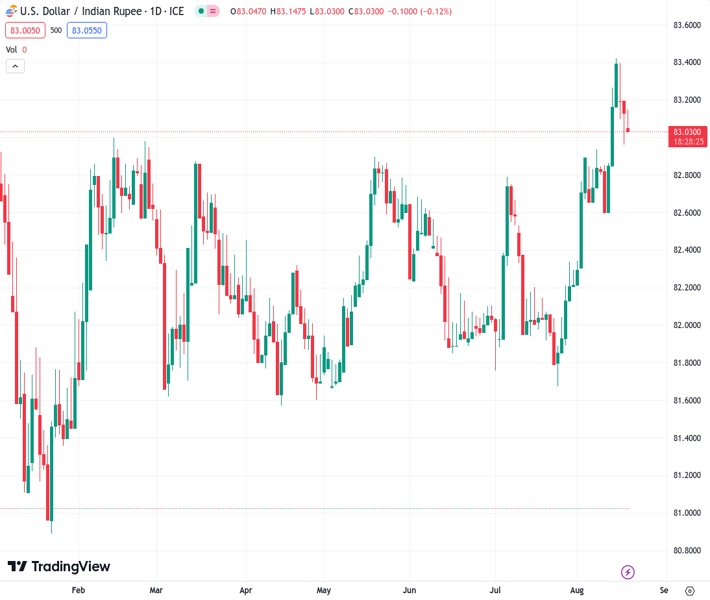
The USDINR currency pair has experienced a decrease in value over the past three days and is currently trading near its lowest point of the day.
…
This is a premium post.
[s2If !current_user_can(access_s2member_level4)]Please register for FREE REGISTER to read full post below containing analysis. In case of any error or you think you are not able to read the full post below, please email us at support#nehcap.com [lwa][/s2If] [s2If current_user_can(access_s2member_level1)]
- USD/INR prints three-day losing streak, holds lower grounds near intraday bottom of late.
The pair currently trades last at 83.0150.
The previous day high was 83.3225 while the previous day low was 82.985. The daily 38.2% Fib levels comes at 83.1139, expected to provide resistance. Similarly, the daily 61.8% fib level is at 83.1936, expected to provide resistance.
USD/INR remains pressured around 83.00, down for the third consecutive day heading into Friday’s European session, as market players prepare for the next week’s top-tier events amid a light calendar at home. Also favoring the Indian Rupee (INR) buyers is the downbeat US Dollar as it traces the Treasury bond yields after refreshing the Year-To-Date (YTD) top.
However, the pessimism surrounding China and the latest recovery in the WTI crude oil price, India’s biggest import burden, prod the USD/INR sellers amid a sluggish Asian session.
That said, the US Dollar Index (DXY) clings to mild losses near 103.20 as the Greenback buyers remain hopeful despite the latest pullback in prices, as well as the yields. It should be noted that the US 10-year Treasury bond yields dropped by around five basis points (bps) in the last hour to 4.25% as market players brace for the next week’s central bankers’ speeches at the Jackson Hole Symposium amid a light calendar.
On the other hand, WTI crude oil stays firmer for the second consecutive day while rising half a percent to $80.00 by the press time. Even so, the black gold eyes the first weekly loss in eight amid fears emanating from China.
Talking about China, the Dragon Nation’s second-large realtor, as well as the world’s most heavily indebted property developer, Evergrande filed for protection from creditors in a US bankruptcy court on Thursday, per Reuters, which in turn propelled the market’s fears. The same escalates woes surrounding the world’s second-largest economy, as well as the global economic transition, as it battles with the slowing economic recovery and fuels concerns about the financial health of China’s biggest realtor, namely Country Garden. Amid these fears, top-tier US banks like JP Morgan and Barclays have recently cut China growth forecasts.
It should be noted, however, that the concerns about Chinese policymakers’ readiness for more stimulus to defend the economy from debt woes seem to have favored the cautious optimism in Asia, which in turn weighs on the USD/INR price.
Against this backdrop, S&P500 Futures rebound from the lowest level since June 27, marked the previous day, while stabilizing near the 4,385-90 zone as it prods the three-day losing streak. Further, the MSCI’s Index of Asia-Pacific shares outside Japan extends the previous day’s corrective bounce off an 11-week low marked on Wednesday.
Moving forward, a light calendar and empty news read may allow the USD/INR traders to pare weekly gains.
A daily closing below the three-week-old rising support line, close to the 83.00 round figure by the press time, becomes necessary for the USD/INR pair sellers to keep the reins.
Technical Levels: Supports and Resistances
USDINR currently trading at 83.033 at the time of writing. Pair opened at 83.0958 and is trading with a change of -0.08% % .
| Overview | Overview.1 | |
|---|---|---|
| 0 | Today last price | 83.033 |
| 1 | Today Daily Change | -0.0628 |
| 2 | Today Daily Change % | -0.08% |
| 3 | Today daily open | 83.0958 |
The pair remains strongly bullish on the daily timeframe. It trades above its 20 SMA @ 82.6408, 50 SMA 82.3425, 100 SMA @ 82.2652 and 200 SMA @ 82.2121.
| Trends | Trends.1 | |
|---|---|---|
| 0 | Daily SMA20 | 82.6408 |
| 1 | Daily SMA50 | 82.3425 |
| 2 | Daily SMA100 | 82.2652 |
| 3 | Daily SMA200 | 82.2121 |
The previous day high was 83.3225 while the previous day low was 82.985. The daily 38.2% Fib levels comes at 83.1139, expected to provide resistance. Similarly, the daily 61.8% fib level is at 83.1936, expected to provide resistance.
Note the levels of interest below:
- Pivot support is noted at 82.9463, 82.7969, 82.6088
- Pivot resistance is noted at 83.2838, 83.4719, 83.6213
| Levels | Levels.1 |
|---|---|
| Previous Daily High | 83.3225 |
| Previous Daily Low | 82.9850 |
| Previous Weekly High | 83.0466 |
| Previous Weekly Low | 82.5854 |
| Previous Monthly High | 82.8334 |
| Previous Monthly Low | 81.6588 |
| Daily Fibonacci 38.2% | 83.1139 |
| Daily Fibonacci 61.8% | 83.1936 |
| Daily Pivot Point S1 | 82.9463 |
| Daily Pivot Point S2 | 82.7969 |
| Daily Pivot Point S3 | 82.6088 |
| Daily Pivot Point R1 | 83.2838 |
| Daily Pivot Point R2 | 83.4719 |
| Daily Pivot Point R3 | 83.6213 |
[/s2If]
Download Nehcap EAWe have two EAs that are operational on our LIVE accounts.
- EA-FIX: Check out the details here. Download EA-FIX . EA-FIX is a non-grid HFT scalper.
- EA-GROWTH: High quality low dd EA using trend grids. Download EA_GROWTHJoin Our Telegram Group
")


