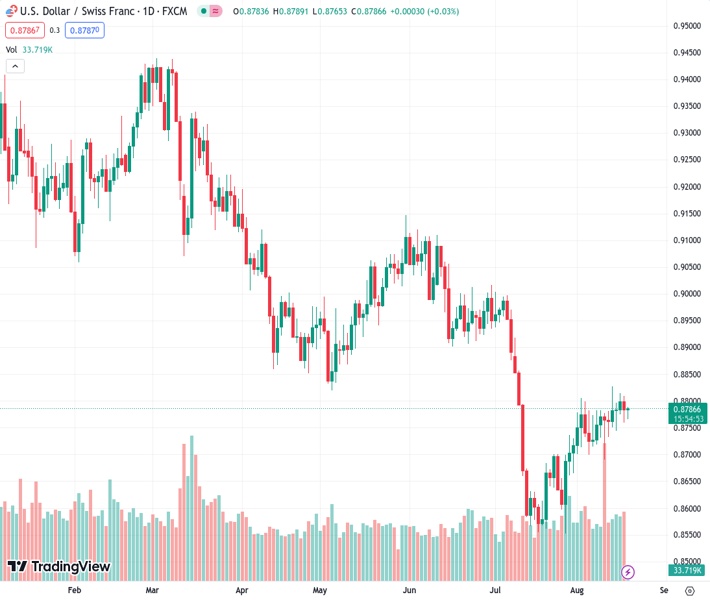
The USDCHF pair, currently trading at 0.87864, is not showing much potential for downward movement as it already saw a bearish trend in the previous day.
…
This is a premium post.
[s2If !current_user_can(access_s2member_level4)]Please register for FREE REGISTER to read full post below containing analysis. In case of any error or you think you are not able to read the full post below, please email us at support#nehcap.com [lwa][/s2If] [s2If current_user_can(access_s2member_level1)]
- USD/CHF lacks downside momentum after welcoming bears the previous day.
The pair currently trades last at 0.87864.
The previous day high was 0.881 while the previous day low was 0.876. The daily 38.2% Fib levels comes at 0.8779, expected to provide support. Similarly, the daily 61.8% fib level is at 0.8791, expected to provide resistance.
USD/CHF struggles for clear directions around 0.8780 after posting the first daily loss of the week the previous day.
In doing so, the Swiss Franc (CHF) pair traces the market’s lackluster moves amid anxiety ahead of the mid-ties Swiss data, as well as the next week’s annual event at the Jackson Hole Symposium where the top-tier central bankers speak.
That said, a light calendar and the market’s mixed feelings about the risk appetite also test the USD/CHF momentum traders as the yields retreat but the optimists hesitate to take control.
US 10-year Treasury bond yields dropped by around five basis points (bps) in the last hour to 4.25%.
On the other hand, S&P500 Futures rebound from the lowest level since June 27, marked the previous day, while stabilizing near the 4,385-90 zone as it prods the three-day losing streak. Further, the MSCI’s Index of Asia-Pacific shares outside Japan extends the previous day’s corrective bounce off an 11-week low marked on Wednesday.
Amid these plays, the US Dollar Index (DXY) clings to mild losses near 103.20 as the Greenback buyers remain hopeful despite the latest pullback in prices, as well as the yields. The reason could be linked to this week’s mostly upbeat US data and hawkish Fed Minutes.
On Wednesday, US Philadelphia Fed Manufacturing Survey marked the strongest print since April 2022, as well as the first positive outcome in a year, while rising to 12.0 for August from -13.5 prior and -10.0 expected. On the same line, the US Initial Jobless Claims also edged lower to 239K for the week ended on August 11 versus a revised up 250K prior and the market expectations of 240K. Earlier in the week, the US Industrial Production and Retail Sales for July marked surprising growth but the housing numbers were mixed.
That said, the latest Fed Minutes showed that most policymakers preferred supporting the battle again the ‘sticky’ inflation, despite being divided on the imminent rate hike, which in turn challenges the market’s previous policy pivot concerns about the US central bank.
On a different page, China’s second-large realtor, as well as the world’s most heavily indebted property developer, Evergrande filed for protection from creditors in a US bankruptcy court on Thursday, per Reuters, which in turn propelled the market’s fears. The same escalates woes surrounding the world’s second-largest economy, as well as the global economic transition, as it battles with the slowing economic recovery and fuels concerns about the financial health of China’s biggest realtor, namely Country Garden. However, the concerns about Chinese policymakers’ readiness for more stimulus to defend the economy from debt woes seem to have challenged the pessimists.
Looking ahead, Swiss Industrial Production for the second quarter of 2023, prior 3.4% YoY, will offer immediate directions to the USD/CHF pair. However, major attention will be given to the risk catalysts amid a light calendar elsewhere.
A one-month-old rising wedge bearish chart formation, currently between 0.8840 and 0.8740, keeps the USD/CHF sellers hopeful despite the pair’s latest inaction.
Technical Levels: Supports and Resistances
USDCHF currently trading at 0.8782 at the time of writing. Pair opened at 0.8784 and is trading with a change of -0.02% % .
| Overview | Overview.1 | |
|---|---|---|
| 0 | Today last price | 0.8782 |
| 1 | Today Daily Change | -0.0002 |
| 2 | Today Daily Change % | -0.02% |
| 3 | Today daily open | 0.8784 |
The pair is trading above its 20 Daily moving average @ 0.8733, below its 50 Daily moving average @ 0.882 , below its 100 Daily moving average @ 0.8906 and below its 200 Daily moving average @ 0.9103
| Trends | Trends.1 | |
|---|---|---|
| 0 | Daily SMA20 | 0.8733 |
| 1 | Daily SMA50 | 0.8820 |
| 2 | Daily SMA100 | 0.8906 |
| 3 | Daily SMA200 | 0.9103 |
The previous day high was 0.881 while the previous day low was 0.876. The daily 38.2% Fib levels comes at 0.8779, expected to provide support. Similarly, the daily 61.8% fib level is at 0.8791, expected to provide resistance.
Note the levels of interest below:
- Pivot support is noted at 0.876, 0.8735, 0.871
- Pivot resistance is noted at 0.8809, 0.8834, 0.8859
| Levels | Levels.1 |
|---|---|
| Previous Daily High | 0.8810 |
| Previous Daily Low | 0.8760 |
| Previous Weekly High | 0.8783 |
| Previous Weekly Low | 0.8690 |
| Previous Monthly High | 0.9005 |
| Previous Monthly Low | 0.8552 |
| Daily Fibonacci 38.2% | 0.8779 |
| Daily Fibonacci 61.8% | 0.8791 |
| Daily Pivot Point S1 | 0.8760 |
| Daily Pivot Point S2 | 0.8735 |
| Daily Pivot Point S3 | 0.8710 |
| Daily Pivot Point R1 | 0.8809 |
| Daily Pivot Point R2 | 0.8834 |
| Daily Pivot Point R3 | 0.8859 |
[/s2If]
Download Nehcap EAWe have two EAs that are operational on our LIVE accounts.
- EA-FIX: Check out the details here. Download EA-FIX . EA-FIX is a non-grid HFT scalper.
- EA-GROWTH: High quality low dd EA using trend grids. Download EA_GROWTHJoin Our Telegram Group
")


