The USDCAD pair has increased by 0.05% and reached 1.3551 due to worries among investors regarding the ongoing issues faced by China’s shadow banking sector and real estate market.
…
This is a premium post.
[s2If !current_user_can(access_s2member_level4)]Please register for FREE REGISTER to read full post below containing analysis. In case of any error or you think you are not able to read the full post below, please email us at support#nehcap.com [lwa][/s2If] [s2If current_user_can(access_s2member_level1)]
- USD/CAD advances 0.05% to 1.3551, buoyed by investor concerns over China’s shadow bank and real estate crises.
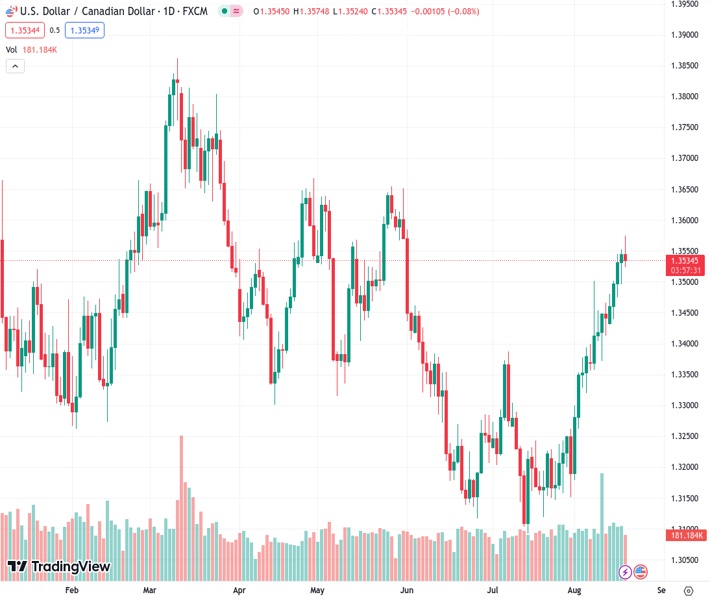
The pair currently trades last at 1.35377.
The previous day high was 1.3553 while the previous day low was 1.3496. The daily 38.2% Fib levels comes at 1.3531, expected to provide support. Similarly, the daily 61.8% fib level is at 1.3518, expected to provide support.
USD/CAD prepares to finish the week on a higher note, with gains of 0.84%, extending its rally to five straight days but remains unable to claim the 1.3600 figure. Risk aversion continues to take its toll on global equities, sparking flows to safe-haven assets. Hence, the USD/CAD is almost flat, exchanging hands at 1.3545.
The pair extended its gains on risk aversion, as investors weighed China’s economic woes. Recent data revealed the second-largest economy is deteriorating. At the same time, the shadow bank crisis and real estate turmoil escalated after Thursday’s news that Evergrande filed for Chapter 15 bankruptcy in New York.
The US economic docket was light, but recent data showed that retail sales pushing above estimates and a robust labor market justifies the Federal Reserve’s (Fed) need to keep monetary policy at restrictive levels. The latest monetary policy meeting minutes emphasized the Fed’s commitment to bring inflation towards its 2% target, though some officials began to be cautious about upcoming meetings.
In the meantime, the Canadian economic calendar revealed that July Producer Prices rose by 0.4%, exceeding June’s -0.6% plunge, underpinned by oil and lumber prices. Raw materials prices rose 3.5% in July but remained down 11.1% in the year.
The USD/CAD remained on the front foot, but a late uptick in oil prices shifted the USD/CAD negative. The US Dollar Index (DXY), a gauge of the greenback’s value against a basket of six currencies, hovered around two-month highs but retraced to 103.389, almost flat. The US Treasury bond yields pare some of its losses, with the US 10-year Treasury note yielding 4.239%, down four bps.
The USD/CAD bias remains upward as price action cleared the 200-day Moving Average (DMA) at 1.3451, though it faltered to clear the May 30 daily low turned resistance at 1.3567, which once reclaimed, as the USD/CAD pair would rally towards the May 26 swing high at 1.3654. If that level is cleared, the year-to-date (YTD) high would be up for grabs at 1.3862.
Technical Levels: Supports and Resistances
USDCAD currently trading at 1.3541 at the time of writing. Pair opened at 1.3545 and is trading with a change of -0.03 % .
| Overview | Overview.1 | |
|---|---|---|
| 0 | Today last price | 1.3541 |
| 1 | Today Daily Change | -0.0004 |
| 2 | Today Daily Change % | -0.0300 |
| 3 | Today daily open | 1.3545 |
The pair remains strongly bullish on the daily timeframe. It trades above its 20 SMA @ 1.3347, 50 SMA 1.3278, 100 SMA @ 1.3384 and 200 SMA @ 1.3452.
| Trends | Trends.1 | |
|---|---|---|
| 0 | Daily SMA20 | 1.3347 |
| 1 | Daily SMA50 | 1.3278 |
| 2 | Daily SMA100 | 1.3384 |
| 3 | Daily SMA200 | 1.3452 |
The previous day high was 1.3553 while the previous day low was 1.3496. The daily 38.2% Fib levels comes at 1.3531, expected to provide support. Similarly, the daily 61.8% fib level is at 1.3518, expected to provide support.
Note the levels of interest below:
- Pivot support is noted at 1.351, 1.3475, 1.3454
- Pivot resistance is noted at 1.3567, 1.3588, 1.3623
| Levels | Levels.1 |
|---|---|
| Previous Daily High | 1.3553 |
| Previous Daily Low | 1.3496 |
| Previous Weekly High | 1.3502 |
| Previous Weekly Low | 1.3356 |
| Previous Monthly High | 1.3387 |
| Previous Monthly Low | 1.3093 |
| Daily Fibonacci 38.2% | 1.3531 |
| Daily Fibonacci 61.8% | 1.3518 |
| Daily Pivot Point S1 | 1.3510 |
| Daily Pivot Point S2 | 1.3475 |
| Daily Pivot Point S3 | 1.3454 |
| Daily Pivot Point R1 | 1.3567 |
| Daily Pivot Point R2 | 1.3588 |
| Daily Pivot Point R3 | 1.3623 |
[/s2If]
Download Nehcap EAWe have two EAs that are operational on our LIVE accounts.
- EA-FIX: Check out the details here. Download EA-FIX . EA-FIX is a non-grid HFT scalper.
- EA-GROWTH: High quality low dd EA using trend grids. Download EA_GROWTHJoin Our Telegram Group
")


