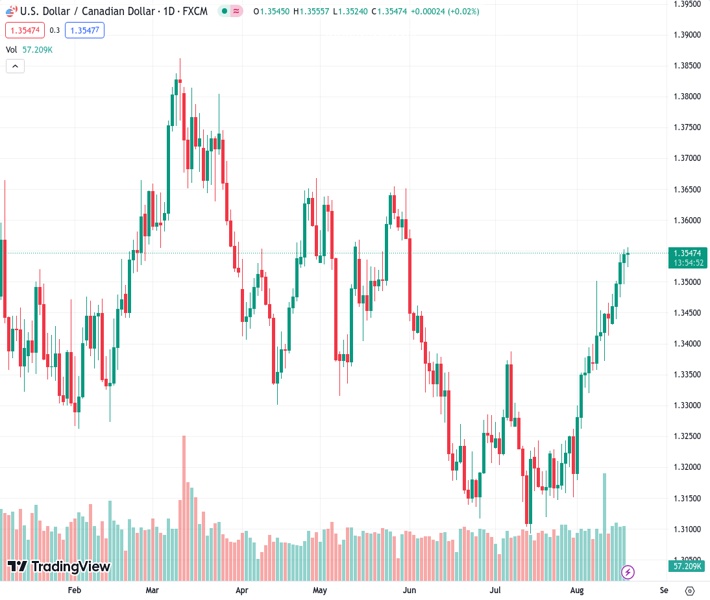
The USDCAD currency pair, which reached a multi-day high at a rate of 1.35447, has started to decline due to slow market conditions, resulting in its first loss within a single day in five days.
…
This is a premium post.
[s2If !current_user_can(access_s2member_level4)]Please register for FREE REGISTER to read full post below containing analysis. In case of any error or you think you are not able to read the full post below, please email us at support#nehcap.com [lwa][/s2If] [s2If current_user_can(access_s2member_level1)]
- USD/CAD reverses from multi-day high amid sluggish markets, prints the first intraday loss in five.
The pair currently trades last at 1.35447.
The previous day high was 1.3553 while the previous day low was 1.3496. The daily 38.2% Fib levels comes at 1.3531, expected to provide support. Similarly, the daily 61.8% fib level is at 1.3518, expected to provide support.
USD/CAD languishes at the highest level since June 01, recently easing from the multi-day top, as market players seek more clues to defend the five-day uptrend heading into Friday’s European session. In doing so, the Loonie pair justifies recently firmer prices of the WTI crude oil, Canada’s key export item, as well as benefits from the US Dollar’s retreat.
US Dollar Index (DXY) clings to mild losses near 103.30 as it prints the second loss-making day after refreshing the two-month high the previous day. The Greenback’s latest weakness could be linked to the softer Treasury bond yields. It should be noted that the US 10-year Treasury bond yields dropped by around five basis points (bps) in the last hour to 4.25% as market players brace for the next week’s central bankers’ speeches at the Jackson Hole Symposium amid a light calendar.
On the other hand, WTI crude oil stays firmer for the second consecutive day while rising half a percent to $80.00 by the press time. Even so, the black gold eyes the first weekly loss in eight amid fears emanating from China. That said, the energy benchmark’s latest gains could be linked to hopes of more stimulus to tame the debt woes after China’s Evergrande filed for bankruptcy proceedings in the US.
Even so, the downbeat prints of the second-tier investment and employment statistics from Canada contrast with the upbeat US activity numbers, Retail Sales and wage growth to keep the USD/CAD buyers hopeful. Elsewhere the latest Fed Minutes showed that most policymakers preferred supporting the battle again the ‘sticky’ inflation, despite being divided on the imminent rate hike, which in turn challenges the market’s previous policy pivot concerns about the US central bank and favors the hopes of the Loonie pair.
Amid these plays, stock futures in the US and Europe stay defensive at the weekly lows.
Moving on, Canada Industrial Production and Raw Material Prices for July will decorate the calendar and provide fresh impetus to the USD/CAD pair. However, major attention will be given to the next week’s central bankers’ comments and preliminary PMIs for August.
USD/CAD pairs’ sustained trading below a three-week-old rising support line, near 1.3520 at the latest, precedes a clear upside break of a five-month-old previous resistance line, close to 1.3450 by the press time, to challenge the bears, especially amid the overbought RSI.
Technical Levels: Supports and Resistances
USDCAD currently trading at 1.3538 at the time of writing. Pair opened at 1.3545 and is trading with a change of -0.05% % .
| Overview | Overview.1 | |
|---|---|---|
| 0 | Today last price | 1.3538 |
| 1 | Today Daily Change | -0.0007 |
| 2 | Today Daily Change % | -0.05% |
| 3 | Today daily open | 1.3545 |
The pair remains strongly bullish on the daily timeframe. It trades above its 20 SMA @ 1.3347, 50 SMA 1.3278, 100 SMA @ 1.3384 and 200 SMA @ 1.3452.
| Trends | Trends.1 | |
|---|---|---|
| 0 | Daily SMA20 | 1.3347 |
| 1 | Daily SMA50 | 1.3278 |
| 2 | Daily SMA100 | 1.3384 |
| 3 | Daily SMA200 | 1.3452 |
The previous day high was 1.3553 while the previous day low was 1.3496. The daily 38.2% Fib levels comes at 1.3531, expected to provide support. Similarly, the daily 61.8% fib level is at 1.3518, expected to provide support.
Note the levels of interest below:
- Pivot support is noted at 1.351, 1.3475, 1.3454
- Pivot resistance is noted at 1.3567, 1.3588, 1.3623
| Levels | Levels.1 |
|---|---|
| Previous Daily High | 1.3553 |
| Previous Daily Low | 1.3496 |
| Previous Weekly High | 1.3502 |
| Previous Weekly Low | 1.3356 |
| Previous Monthly High | 1.3387 |
| Previous Monthly Low | 1.3093 |
| Daily Fibonacci 38.2% | 1.3531 |
| Daily Fibonacci 61.8% | 1.3518 |
| Daily Pivot Point S1 | 1.3510 |
| Daily Pivot Point S2 | 1.3475 |
| Daily Pivot Point S3 | 1.3454 |
| Daily Pivot Point R1 | 1.3567 |
| Daily Pivot Point R2 | 1.3588 |
| Daily Pivot Point R3 | 1.3623 |
[/s2If]
Download Nehcap EAWe have two EAs that are operational on our LIVE accounts.
- EA-FIX: Check out the details here. Download EA-FIX . EA-FIX is a non-grid HFT scalper.
- EA-GROWTH: High quality low dd EA using trend grids. Download EA_GROWTHJoin Our Telegram Group
")


