The price of silver increased by 0.07% on Friday due to a decrease in US Treasury bond yields and a somewhat uncertain market outlook.
…
This is a premium post.
[s2If !current_user_can(access_s2member_level4)]Please register for FREE REGISTER to read full post below containing analysis. In case of any error or you think you are not able to read the full post below, please email us at support#nehcap.com [lwa][/s2If] [s2If current_user_can(access_s2member_level1)]
- Silver price edges up 0.07% on Friday, buoyed by a dip in US Treasury bond yields and a mixed market sentiment.
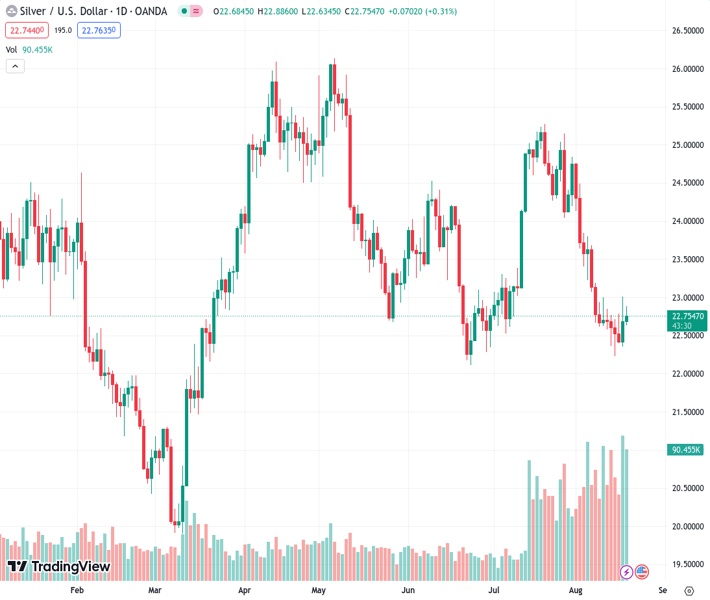
The pair currently trades last at 22.753.
The previous day high was 23.01 while the previous day low was 22.35. The daily 38.2% Fib levels comes at 22.76, expected to provide resistance. Similarly, the daily 61.8% fib level is at 22.61, expected to provide support.
Silver price recovers some bright towards the end of the week, climbing 0.07% on Friday, underpinned by US Treasury bond yields falling, while the Greenback trims its weekly gains. Mixed sentiment surrounding the financial markets was another reason for the non-yielding metal to climb in the session, The XAG/USD is trading at $22.74 after hitting a daily low of $22.64.
Although XAG/USD would finish the week with gains, price action offered sellers a better entry price on Thursday, particularly for traders entering nearby the weekly highs of $23.00. Buyers’ failure to extend its gains, and reclaim the 200-day Moving Average (DMA) at $23.29, keeps the white metal exposed to selling pressure.
From an intraday perspective, the XAG/USD remains trading sideways, slightly tilted upwards, with upside risks remaining, as XAG/USD is testing a downslope resistance trendline. A breach of the latter will expose the $22.80 price level, followed by the confluence of the weekly high and Friday’s R1 daily pivot at around $23.00 per ounce.
A decisive break would expose the June 15 daily low turned resistance at $23.22, ahead of testing the June 8 low at $23.42.
Technical Levels: Supports and Resistances
XAGUSD currently trading at 22.76 at the time of writing. Pair opened at 22.68 and is trading with a change of 0.35 % .
| Overview | Overview.1 | |
|---|---|---|
| 0 | Today last price | 22.76 |
| 1 | Today Daily Change | 0.08 |
| 2 | Today Daily Change % | 0.35 |
| 3 | Today daily open | 22.68 |
The pair remains strongly bearish on the daily time frame. It trades below the 20 SMA @ 23.56, 50 SMA 23.56, 100 SMA @ 24.03 and 200 SMA @ 23.29.
| Trends | Trends.1 | |
|---|---|---|
| 0 | Daily SMA20 | 23.56 |
| 1 | Daily SMA50 | 23.56 |
| 2 | Daily SMA100 | 24.03 |
| 3 | Daily SMA200 | 23.29 |
The previous day high was 23.01 while the previous day low was 22.35. The daily 38.2% Fib levels comes at 22.76, expected to provide resistance. Similarly, the daily 61.8% fib level is at 22.61, expected to provide support.
Note the levels of interest below:
- Pivot support is noted at 22.35, 22.02, 21.69
- Pivot resistance is noted at 23.01, 23.34, 23.67
| Levels | Levels.1 |
|---|---|
| Previous Daily High | 23.01 |
| Previous Daily Low | 22.35 |
| Previous Weekly High | 23.68 |
| Previous Weekly Low | 22.58 |
| Previous Monthly High | 25.27 |
| Previous Monthly Low | 22.52 |
| Daily Fibonacci 38.2% | 22.76 |
| Daily Fibonacci 61.8% | 22.61 |
| Daily Pivot Point S1 | 22.35 |
| Daily Pivot Point S2 | 22.02 |
| Daily Pivot Point S3 | 21.69 |
| Daily Pivot Point R1 | 23.01 |
| Daily Pivot Point R2 | 23.34 |
| Daily Pivot Point R3 | 23.67 |
[/s2If]
Download Nehcap EAWe have two EAs that are operational on our LIVE accounts.
- EA-FIX: Check out the details here. Download EA-FIX . EA-FIX is a non-grid HFT scalper.
- EA-GROWTH: High quality low dd EA using trend grids. Download EA_GROWTHJoin Our Telegram Group
")


