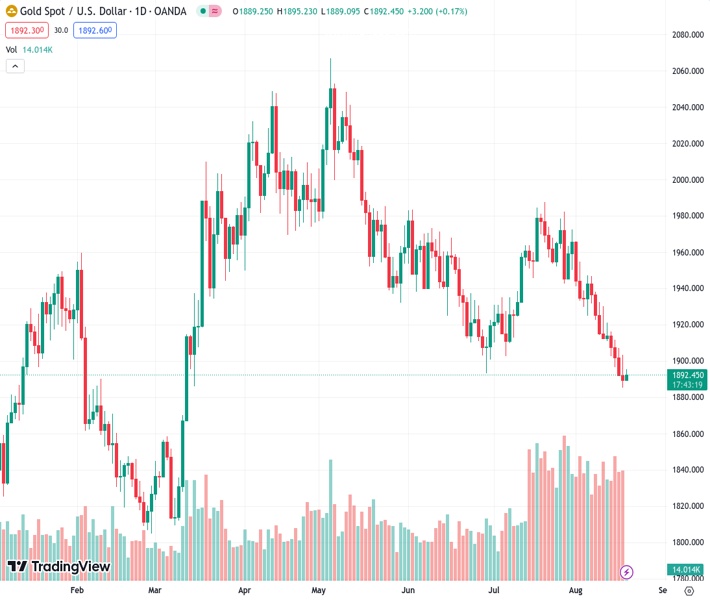
The price of gold, currently at $1,892.34, is rising but encountering difficulties in its pursuit to attain the $1,900 level.
…
This is a premium post.
[s2If !current_user_can(access_s2member_level4)]Please register for FREE REGISTER to read full post below containing analysis. In case of any error or you think you are not able to read the full post below, please email us at support#nehcap.com [lwa][/s2If] [s2If current_user_can(access_s2member_level1)]
- Gold price trades higher but faces challenges in its attempt to reach the $1,900 mark.
The pair currently trades last at 1892.34.
The previous day high was 1903.61 while the previous day low was 1885.13. The daily 38.2% Fib levels comes at 1892.19, expected to provide support. Similarly, the daily 61.8% fib level is at 1896.55, expected to provide resistance.
Gold price trades higher near $1,890 per troy ounce during the Asian session on Friday, showing signs of recovery after experiencing losses for the fourth consecutive week. The retreating US Dollar (USD) has contributed to this rebound in the price of Gold.
However, there remains a likelihood of Gold sellers becoming more active due to factors such as increased risk aversion in the market, the presence of stronger United States (US) Treasury yields, and ongoing economic challenges faced by China. These elements could potentially offset the positive influence of the Greenback’s retreat and impact the overall trajectory of Gold Price.
The Gold price has managed to rebound, even in the face of mid-tier data from the United States (US) that showed stronger figures than anticipated. Initial Jobless Claims (Aug 11) decreased to 239K from the previous 250K, lower than the projected reading of 240,000. Additionally, the Philadelphia Fed Manufacturing Survey for August displayed an improvement, rising to a reading of 12 from the previous -13.5, outperforming the expected -10.
This situation suggests that investors are currently in search of additional cues that could provide them with a clearer understanding of the potential direction of the US Federal Reserve (Fed) regarding monetary policy tightening. This suggests that uncertainties persist in the market, leading investors to remain cautious and seek more information before making definitive decisions.
In the upcoming week, investors will likely watch the release of US economic data, particularly concerning Home Sales and Manufacturing indicators. Additionally, the Jackson Hole Symposium, an annual event, will be a focal point of attention. This gathering will bring together central bankers, policy experts, and academics to delve into the global economic outlook, with a particular emphasis on addressing the ongoing inflation situation. The Symposium provides a platform for key figures in the financial and economic sectors to share insights and perspectives, helping to shape understanding and potential strategies in response to the current inflationary landscape.
Technical Levels: Supports and Resistances
XAUUSD currently trading at 1893.28 at the time of writing. Pair opened at 1889.36 and is trading with a change of 0.21 % .
| Overview | Overview.1 | |
|---|---|---|
| 0 | Today last price | 1893.28 |
| 1 | Today Daily Change | 3.92 |
| 2 | Today Daily Change % | 0.21 |
| 3 | Today daily open | 1889.36 |
The pair remains strongly bearish on the daily time frame. It trades below the 20 SMA @ 1933.62, 50 SMA 1936.57, 100 SMA @ 1963.57 and 200 SMA @ 1906.05.
| Trends | Trends.1 | |
|---|---|---|
| 0 | Daily SMA20 | 1933.62 |
| 1 | Daily SMA50 | 1936.57 |
| 2 | Daily SMA100 | 1963.57 |
| 3 | Daily SMA200 | 1906.05 |
The previous day high was 1903.61 while the previous day low was 1885.13. The daily 38.2% Fib levels comes at 1892.19, expected to provide support. Similarly, the daily 61.8% fib level is at 1896.55, expected to provide resistance.
Note the levels of interest below:
- Pivot support is noted at 1881.79, 1874.22, 1863.31
- Pivot resistance is noted at 1900.27, 1911.18, 1918.75
| Levels | Levels.1 |
|---|---|
| Previous Daily High | 1903.61 |
| Previous Daily Low | 1885.13 |
| Previous Weekly High | 1946.82 |
| Previous Weekly Low | 1910.92 |
| Previous Monthly High | 1987.54 |
| Previous Monthly Low | 1902.77 |
| Daily Fibonacci 38.2% | 1892.19 |
| Daily Fibonacci 61.8% | 1896.55 |
| Daily Pivot Point S1 | 1881.79 |
| Daily Pivot Point S2 | 1874.22 |
| Daily Pivot Point S3 | 1863.31 |
| Daily Pivot Point R1 | 1900.27 |
| Daily Pivot Point R2 | 1911.18 |
| Daily Pivot Point R3 | 1918.75 |
[/s2If]
Download Nehcap EAWe have two EAs that are operational on our LIVE accounts.
- EA-FIX: Check out the details here. Download EA-FIX . EA-FIX is a non-grid HFT scalper.
- EA-GROWTH: High quality low dd EA using trend grids. Download EA_GROWTHJoin Our Telegram Group
")


