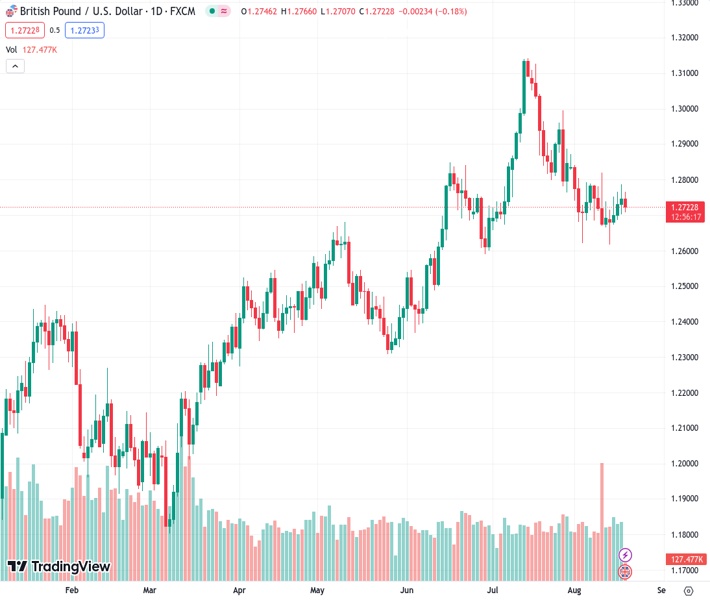
The GBPUSD currency pair is trading at a lower level of approximately 1.2720 following the release of weaker UK Retail Sales data.
…
This is a premium post.
[s2If !current_user_can(access_s2member_level4)]Please register for FREE REGISTER to read full post below containing analysis. In case of any error or you think you are not able to read the full post below, please email us at support#nehcap.com [lwa][/s2If] [s2If current_user_can(access_s2member_level1)]
- GBP/USD trades lower around 1.2720 on the back of softer UK Retail Sales.
The pair currently trades last at 1.27172.
The previous day high was 1.2788 while the previous day low was 1.2703. The daily 38.2% Fib levels comes at 1.2755, expected to provide resistance. Similarly, the daily 61.8% fib level is at 1.2735, expected to provide resistance.
GBP/USD snaps the three-day winning streak, currently hovering around 1.2720 in the Asian session on Friday. The GBP/USD pair is experiencing downward pressure attributed to softer data on consumer spending from the United Kingdom (UK).
The data released on Friday revealed a decline in UK Retail Sales (MoM) to -1.2% from the previous 0.6%, significantly below the expected -0.5% for July. Moreover, the year-on-year figures showed a contraction of -3.2%, against the previous -1.6% and falling short of the projected -2.1%. Additionally, the monthly Retail Sales excluding Fuel experienced a drop to -1.4%, considerably below the consensus of -0.7% and the previous 0.7%. The annual rate also decreased to -3.4% compared to -2.2% expected in July and the prior reading of -1.6%.
Elevated risk aversion, coupled with robust United States (US) Treasury yields and persistent economic difficulties in China, are placing downward pressure on the GBP/USD pair. These factors could contribute to bolstering the strength of the Greenback and potentially influencing the overall direction of the Cable pair.
GBP/USD traders could adopt a more cautious stance following the release of better-than-anticipated UK inflation figures on Wednesday. This surge in data has propelled the pair’s upward movement, potentially amplifying concerns regarding the possibility of interest rate hikes by the Bank of England (BoE) in the upcoming September meeting.
US Dollar Index (DXY) retraces gains achieved over the last three trading sessions. The DXY, which measures the performance of the Greenback against the six major currencies, treads water around 103.40. The pullback of the US Dollar (USD) occurs amid improved US data, leading to a sense of caution in the market as it seeks further signals about the inflation scenario.
As said, Initial Jobless Claims (Aug 11) decreased to 239K from the previous 250K, better than the projected reading of 240K. Moreover, the Philadelphia Fed Manufacturing Survey for August displayed improvement, with a rise to 12 from the prior -13.5, exceeding the expected -10.
In the upcoming week, investors will likely watch the release of US economic data, particularly concerning Home Sales and Manufacturing indicators with UK S&P Global/CIPS Composite PMI and GfK Consumer Confidence for August. These datasets could provide insights and perspectives about financial and economic sectors in both countries, helping to shape potential strategies for placing fresh bets on GBP/USD pair.
Furthermore, the Jackson Hole Symposium during the upcoming week, held annually, will serve as a significant point of interest. This event will convene central bankers, policy experts, and academics to thoroughly examine the global economic forecast, placing particular emphasis on addressing the current inflationary environment.
Technical Levels: Supports and Resistances
GBPUSD currently trading at 1.2721 at the time of writing. Pair opened at 1.2747 and is trading with a change of -0.2 % .
| Overview | Overview.1 | |
|---|---|---|
| 0 | Today last price | 1.2721 |
| 1 | Today Daily Change | -0.0026 |
| 2 | Today Daily Change % | -0.2000 |
| 3 | Today daily open | 1.2747 |
The pair is trading below its 20 Daily moving average @ 1.2772, below its 50 Daily moving average @ 1.2785 , above its 100 Daily moving average @ 1.2624 and above its 200 Daily moving average @ 1.2375
| Trends | Trends.1 | |
|---|---|---|
| 0 | Daily SMA20 | 1.2772 |
| 1 | Daily SMA50 | 1.2785 |
| 2 | Daily SMA100 | 1.2624 |
| 3 | Daily SMA200 | 1.2375 |
The previous day high was 1.2788 while the previous day low was 1.2703. The daily 38.2% Fib levels comes at 1.2755, expected to provide resistance. Similarly, the daily 61.8% fib level is at 1.2735, expected to provide resistance.
Note the levels of interest below:
- Pivot support is noted at 1.2704, 1.2661, 1.2619
- Pivot resistance is noted at 1.2789, 1.2831, 1.2874
| Levels | Levels.1 |
|---|---|
| Previous Daily High | 1.2788 |
| Previous Daily Low | 1.2703 |
| Previous Weekly High | 1.2819 |
| Previous Weekly Low | 1.2666 |
| Previous Monthly High | 1.3142 |
| Previous Monthly Low | 1.2659 |
| Daily Fibonacci 38.2% | 1.2755 |
| Daily Fibonacci 61.8% | 1.2735 |
| Daily Pivot Point S1 | 1.2704 |
| Daily Pivot Point S2 | 1.2661 |
| Daily Pivot Point S3 | 1.2619 |
| Daily Pivot Point R1 | 1.2789 |
| Daily Pivot Point R2 | 1.2831 |
| Daily Pivot Point R3 | 1.2874 |
[/s2If]
Download Nehcap EAWe have two EAs that are operational on our LIVE accounts.
- EA-FIX: Check out the details here. Download EA-FIX . EA-FIX is a non-grid HFT scalper.
- EA-GROWTH: High quality low dd EA using trend grids. Download EA_GROWTHJoin Our Telegram Group
")


