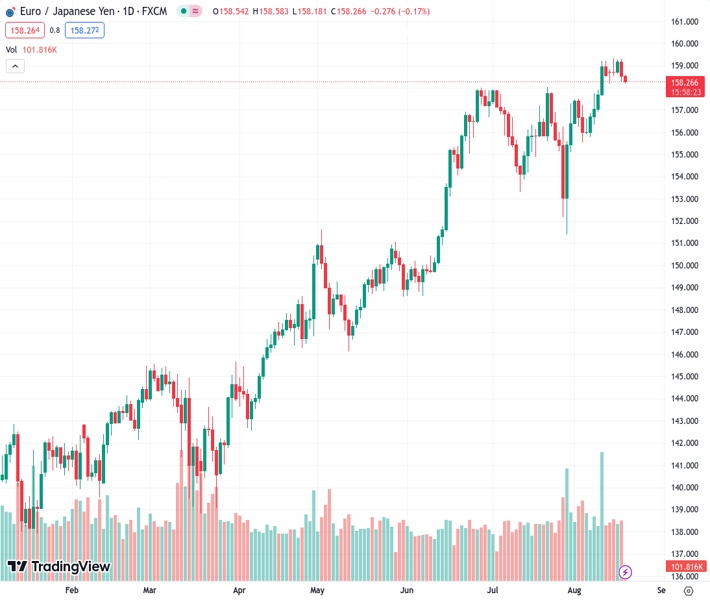
The EURJPY pair is currently trading at a weekly low of 158.300 and is not showing much strength or momentum in recent times. According to the view of @nehcap, it is anticipated that there will be more decline in the future.
…
This is a premium post.
[s2If !current_user_can(access_s2member_level4)]Please register for FREE REGISTER to read full post below containing analysis. In case of any error or you think you are not able to read the full post below, please email us at support#nehcap.com [lwa][/s2If] [s2If current_user_can(access_s2member_level1)]
- EUR/JPY remains on back foot at weekly low, lacks momentum of late.
The pair currently trades last at 158.300.
The previous day high was 159.3 while the previous day low was 158.26. The daily 38.2% Fib levels comes at 158.65, expected to provide resistance. Similarly, the daily 61.8% fib level is at 158.9, expected to provide resistance.
EUR/JPY holds lower ground at the intraday bottom of around 158.20 heading into Friday’s European session. In doing so, the cross-currency pair takes clues from the recent pullback in the Treasury bond yields, as well as upbeat prints of Japan’s inflation data, amid a sluggish trading day.
However, the pair’s clear U-turn from a three-week-old rising trend line and the bearish MACD signals, as well as a downside break of the 50-SMA, gain major attention to keep the sellers hopeful.
It’s worth noting that the previous resistance line from late June restricts immediate downside of the EUR/JPY pair around 157.60.
Following that, the 200-SMA level surrounding 156.55 will act as the final defense of the EUR/JPY buyers.
In a case where the quote remains bearish past 156.55, multiple supports around 155.50 and 153.40 may prod the sellers before directing them to the previous monthly low of around 151.40.
On the contrary, a clear upside break of the 50-SMA level of 158.45 becomes necessary for the EUR/JPY buyer’s return.
Even so, an ascending trend line from July 21, close to 159.55, quickly followed by the 160.00 round figure, will challenge the EUR/JPY bulls afterward.
Trend: Further downside expected
Technical Levels: Supports and Resistances
EURJPY currently trading at 158.28 at the time of writing. Pair opened at 158.56 and is trading with a change of -0.18% % .
| Overview | Overview.1 | |
|---|---|---|
| 0 | Today last price | 158.28 |
| 1 | Today Daily Change | -0.28 |
| 2 | Today Daily Change % | -0.18% |
| 3 | Today daily open | 158.56 |
The pair remains strongly bullish on the daily timeframe. It trades above its 20 SMA @ 157.09, 50 SMA 156.06, 100 SMA @ 152.0 and 200 SMA @ 147.27.
| Trends | Trends.1 | |
|---|---|---|
| 0 | Daily SMA20 | 157.09 |
| 1 | Daily SMA50 | 156.06 |
| 2 | Daily SMA100 | 152.00 |
| 3 | Daily SMA200 | 147.27 |
The previous day high was 159.3 while the previous day low was 158.26. The daily 38.2% Fib levels comes at 158.65, expected to provide resistance. Similarly, the daily 61.8% fib level is at 158.9, expected to provide resistance.
Note the levels of interest below:
- Pivot support is noted at 158.11, 157.66, 157.07
- Pivot resistance is noted at 159.16, 159.75, 160.2
| Levels | Levels.1 |
|---|---|
| Previous Daily High | 159.30 |
| Previous Daily Low | 158.26 |
| Previous Weekly High | 159.22 |
| Previous Weekly Low | 155.81 |
| Previous Monthly High | 158.05 |
| Previous Monthly Low | 151.41 |
| Daily Fibonacci 38.2% | 158.65 |
| Daily Fibonacci 61.8% | 158.90 |
| Daily Pivot Point S1 | 158.11 |
| Daily Pivot Point S2 | 157.66 |
| Daily Pivot Point S3 | 157.07 |
| Daily Pivot Point R1 | 159.16 |
| Daily Pivot Point R2 | 159.75 |
| Daily Pivot Point R3 | 160.20 |
[/s2If]
Download Nehcap EAWe have two EAs that are operational on our LIVE accounts.
- EA-FIX: Check out the details here. Download EA-FIX . EA-FIX is a non-grid HFT scalper.
- EA-GROWTH: High quality low dd EA using trend grids. Download EA_GROWTHJoin Our Telegram Group
")


