The EURJPY currency pair is trading with a slight bearish inclination for the second consecutive day, but it is not showing strong continuation in that direction.
…
This is a premium post.
[s2If !current_user_can(access_s2member_level4)]Please register for FREE REGISTER to read full post below containing analysis. In case of any error or you think you are not able to read the full post below, please email us at support#nehcap.com [lwa][/s2If] [s2If current_user_can(access_s2member_level1)]
- EUR/JPY trades with a mild negative bias for the second straight day, though lacks follow-through.
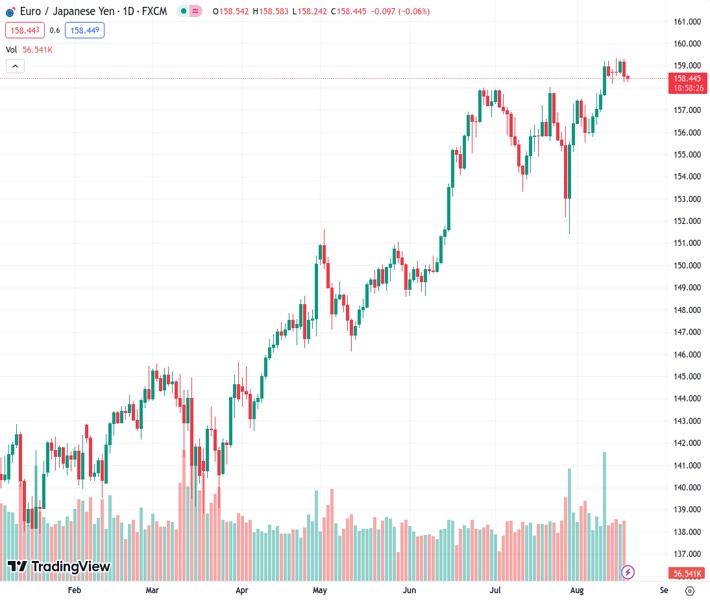
The pair currently trades last at 158.427.
The previous day high was 159.3 while the previous day low was 158.26. The daily 38.2% Fib levels comes at 158.65, expected to provide resistance. Similarly, the daily 61.8% fib level is at 158.9, expected to provide resistance.
The EUR/JPY cross remains under some selling pressure for the second successive day on Friday, albeit lacks follow-through and remains confined in a familiar range held over the past week or so. Spot prices currently trade around the 158.35-158.30 region, down less than 0.15% for the day. Moreover, the fundamental backdrop warrants caution before positioning for any meaningful corrective decline from the highest level since September 2008, around the 159.30-159.35 region touched this week.
Against the backdrop of the worsening economic conditions in China, worries about headwinds stemming from rapidly rising borrowing costs fuel recession fears and temper investors’ appetite for riskier assets. This is evident from a generally weaker tone around the equity markets, which benefits the safe-haven Japanese Yen (JPY) and weighs on the EUR/JPY cross. Apart from this, speculations that the recent weakness in the domestic currency might prompt some jawboning from Japanese authorities, or a possible intervention in the foreign exchange markets, further underpin the JPY.
In fact, Japan’s top forex diplomat Masato Kanda said on Tuesday that he would take appropriate steps against excessive currency moves. That said, Japan’s Finance Minister Shunichi Suzuki said that authorities are not targeting absolute currency levels when it comes to intervening in the market. Apart from this, a more dovish stance adopted by the Bank of Japan (BoJ) should keep a lid on any meaningful gains for the JPY and help limit the downside for the EUR/JPY cross, at least for the time being. It is worth recalling that Boj is the only major central bank in the world to maintain negative interest rates.
Moreover, policymakers have stressed that steps taken in July to make the BoJ’s Yield Curve Control (YCC) measures more flexible and allow yield on the 10-year Japanese government bond to move up toward 1% was a technical tweak aimed at extending the shelf life of stimulus. This marks a big divergence in comparison to other major central banks, including the European Central Bank, which has raised borrowing costs by a combined 425 bps since last July. This, along with bets for one more rate hike by the end of this year, supports prospects for the emergence of some dip-buying around the EUR/JPY cross.
In the absence of any relevant market-moving economic releases on Friday, the aforementioned fundamental backdrop makes it prudent to wait for strong follow-through selling before confirming that spot prices have topped out in the near term. Nevertheless, the EUR/JPY cross seems poised to register modest losses for the first time in the previous three weeks as investors now look to next week’s release of the flash Euro Zone PMI prints for some meaningful impetus.
Technical Levels: Supports and Resistances
EURJPY currently trading at 158.35 at the time of writing. Pair opened at 158.56 and is trading with a change of -0.13 % .
| Overview | Overview.1 | |
|---|---|---|
| 0 | Today last price | 158.35 |
| 1 | Today Daily Change | -0.21 |
| 2 | Today Daily Change % | -0.13 |
| 3 | Today daily open | 158.56 |
The pair remains strongly bullish on the daily timeframe. It trades above its 20 SMA @ 157.09, 50 SMA 156.06, 100 SMA @ 152.0 and 200 SMA @ 147.27.
| Trends | Trends.1 | |
|---|---|---|
| 0 | Daily SMA20 | 157.09 |
| 1 | Daily SMA50 | 156.06 |
| 2 | Daily SMA100 | 152.00 |
| 3 | Daily SMA200 | 147.27 |
The previous day high was 159.3 while the previous day low was 158.26. The daily 38.2% Fib levels comes at 158.65, expected to provide resistance. Similarly, the daily 61.8% fib level is at 158.9, expected to provide resistance.
Note the levels of interest below:
- Pivot support is noted at 158.11, 157.66, 157.07
- Pivot resistance is noted at 159.16, 159.75, 160.2
| Levels | Levels.1 |
|---|---|
| Previous Daily High | 159.30 |
| Previous Daily Low | 158.26 |
| Previous Weekly High | 159.22 |
| Previous Weekly Low | 155.81 |
| Previous Monthly High | 158.05 |
| Previous Monthly Low | 151.41 |
| Daily Fibonacci 38.2% | 158.65 |
| Daily Fibonacci 61.8% | 158.90 |
| Daily Pivot Point S1 | 158.11 |
| Daily Pivot Point S2 | 157.66 |
| Daily Pivot Point S3 | 157.07 |
| Daily Pivot Point R1 | 159.16 |
| Daily Pivot Point R2 | 159.75 |
| Daily Pivot Point R3 | 160.20 |
[/s2If]
Download Nehcap EAWe have two EAs that are operational on our LIVE accounts.
- EA-FIX: Check out the details here. Download EA-FIX . EA-FIX is a non-grid HFT scalper.
- EA-GROWTH: High quality low dd EA using trend grids. Download EA_GROWTHJoin Our Telegram Group
")


