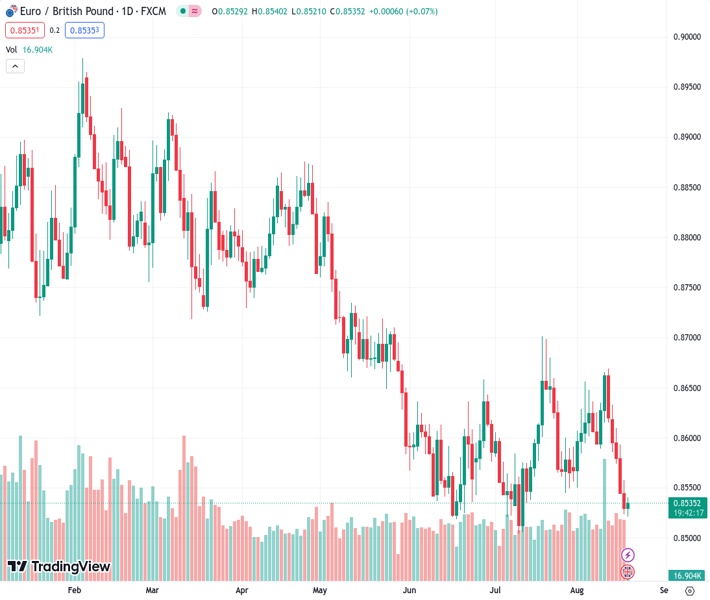
The EURGBP currency pair has achieved small advances, recovering from its lowest point of 0.8521 during the week and currently trading at 0.85336.
…
This is a premium post.
[s2If !current_user_can(access_s2member_level4)]Please register for FREE REGISTER to read full post below containing analysis. In case of any error or you think you are not able to read the full post below, please email us at support#nehcap.com [lwa][/s2If] [s2If current_user_can(access_s2member_level1)]
- EUR/GBP posts modest gains, bouncing off the weekly low of 0.8521 on Friday.
The pair currently trades last at 0.85336.
The previous day high was 0.8557 while the previous day low was 0.8524. The daily 38.2% Fib levels comes at 0.8536, expected to provide resistance. Similarly, the daily 61.8% fib level is at 0.8544, expected to provide resistance.
The EUR/GBP cross recovers some lost ground and snaps five days of losing streaks during the early Asian session on Friday. The cross currently trades near 0.8540, gaining 0.11% on the day. Market players await the release of the UK Retail Sales MoM for July. The monthly figure is expected to drop by 0.5%.
Eurostat revealed on Thursday that June’s trade surplus in the Eurozone was $23.0 billion ($25.01 billion), compared to a deficit of $27.1 billion in the same month in 2022. Additionally, the Exports YoY rose 0.3%, while Imports plunged 17.7% with significant drops in shipments from both Russia and China.
Earlier this week, the preliminary Eurozone Gross Domestic Product (GDP) for the second quarter came in at 0.3% and 0.6% YoY, matching expectations. Meanwhile, Eurozone Industrial Production for June MoM improved to 0.5% versus -0.1% market consensus and 0.0% prior. The monthly Industrial Output data rose by 0.5% versus the estimation of a 0.1% decline.
The stronger-than-expected data from the Eurozone, however, failed to lift the Euro against its rivals as the prospects for economic growth and inflation are still uncertain. This, in turn, limits the upside for the Euro and acts as a headwind for the EUR/GBP cross.
On the other hand, the UK’s National Statistics reported on Wednesday that the nation’s Consumer Price Index (CPI) MoM came in at -0.4%, above the market consensus of -0.5% versus the previous reading of 0.1%. On a yearly basis, British CPI inflation rose 6.8% for June, as expected at 6.8%. The core CPI, which excludes volatile oil and food prices for July, increased by 6.9%, better than the 6.8% estimation.
The prospect of stubborn inflation in the UK economy has increased due to the core CPI data, which might convince the Bank of England (BoE) to maintain its tightening monetary policy. However, the fear of an aggressive rate hike by the BoE might exert pressure on the Pound Sterling as investors worry that it might impact negatively the UK economy.
Moving on, market participants will focus on the UK Retail Sales due later in the European session. Also, the Europen Central Bank (ECB) board member Philip Lane’s speech and the Harmonized Index of Consumer Prices (HICP) for July will be released later in the day. The data will be critical for determining a clear movement for the EUR/GBP cross.
Technical Levels: Supports and Resistances
EURGBP currently trading at 0.854 at the time of writing. Pair opened at 0.853 and is trading with a change of 0.12 % .
| Overview | Overview.1 | |
|---|---|---|
| 0 | Today last price | 0.854 |
| 1 | Today Daily Change | 0.001 |
| 2 | Today Daily Change % | 0.120 |
| 3 | Today daily open | 0.853 |
The pair remains strongly bearish on the daily time frame. It trades below the 20 SMA @ 0.8598, 50 SMA 0.8585, 100 SMA @ 0.866 and 200 SMA @ 0.872.
| Trends | Trends.1 | |
|---|---|---|
| 0 | Daily SMA20 | 0.8598 |
| 1 | Daily SMA50 | 0.8585 |
| 2 | Daily SMA100 | 0.8660 |
| 3 | Daily SMA200 | 0.8720 |
The previous day high was 0.8557 while the previous day low was 0.8524. The daily 38.2% Fib levels comes at 0.8536, expected to provide resistance. Similarly, the daily 61.8% fib level is at 0.8544, expected to provide resistance.
Note the levels of interest below:
- Pivot support is noted at 0.8517, 0.8503, 0.8483
- Pivot resistance is noted at 0.855, 0.8571, 0.8584
| Levels | Levels.1 |
|---|---|
| Previous Daily High | 0.8557 |
| Previous Daily Low | 0.8524 |
| Previous Weekly High | 0.8669 |
| Previous Weekly Low | 0.8590 |
| Previous Monthly High | 0.8701 |
| Previous Monthly Low | 0.8504 |
| Daily Fibonacci 38.2% | 0.8536 |
| Daily Fibonacci 61.8% | 0.8544 |
| Daily Pivot Point S1 | 0.8517 |
| Daily Pivot Point S2 | 0.8503 |
| Daily Pivot Point S3 | 0.8483 |
| Daily Pivot Point R1 | 0.8550 |
| Daily Pivot Point R2 | 0.8571 |
| Daily Pivot Point R3 | 0.8584 |
[/s2If]
Download Nehcap EAWe have two EAs that are operational on our LIVE accounts.
- EA-FIX: Check out the details here. Download EA-FIX . EA-FIX is a non-grid HFT scalper.
- EA-GROWTH: High quality low dd EA using trend grids. Download EA_GROWTHJoin Our Telegram Group
")


