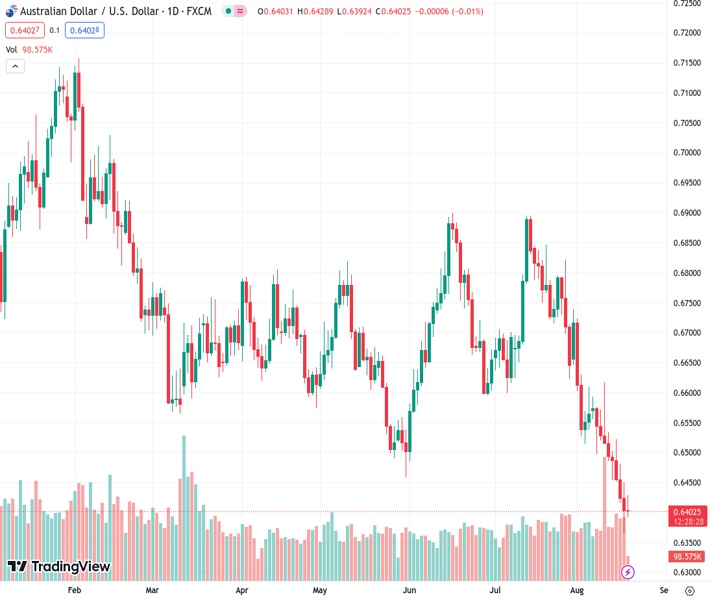
The AUDUSD, trading at 0.63994, finds it challenging to take full advantage of its slight upward movement towards the range of 0.6425-30 on Friday.
…
This is a premium post.
[s2If !current_user_can(access_s2member_level4)]Please register for FREE REGISTER to read full post below containing analysis. In case of any error or you think you are not able to read the full post below, please email us at support#nehcap.com [lwa][/s2If] [s2If current_user_can(access_s2member_level1)]
- AUD/USD struggles to capitalize on its modest intraday gains to the 0.6425-30 area on Friday.
The pair currently trades last at 0.63994.
The previous day high was 0.645 while the previous day low was 0.6364. The daily 38.2% Fib levels comes at 0.6397, expected to provide support. Similarly, the daily 61.8% fib level is at 0.6418, expected to provide resistance.
The AUD/USD pair surrenders its modest intraday gains to the 0.6425-0.6430 region and hovers near the lower end of its daily range during the early European session on Friday. Spot prices currently trade around the 0.6400 round-figure mark and remain well within the striking distance of the lowest level since November 2022 touched the previous day.
Despite talks of additional Chinese stimulus measures, concerns about the worsening economic conditions in the world’s second-largest economy continue to act as a headwind for antipodean currencies, including the Australian Dollar (AUD). The fears were fueled by the fact that China Evergrande Group – one of the country’s biggest real estate developers – has filed for protection from creditors in a US bankruptcy court. This adds to worries about a deepening crisis in China’s property sector and keeps a lid on the AUD/USD pair’s modest intraday uptick.
Apart from this, the disappointing domestic jobs data on Thursday pretty much confirms another on-hold rate decision by the Reserve Bank of Australia (RBA) in September and continues to undermine the Aussie. The US Dollar (USD), on the other hand, reverses a modest intraday dip and stands tall near its highest level in more than two months in the wake of firming expectations that the Federal Reserve (Fed) will keep interest rates higher for longer. This further contributes to keeping a lid on any meaningful upside for the AUD/USD pair.
That said, the Relative Strength Index (RSI) on the daily chart is already flashing oversold conditions and holding back traders from positioning for any further losses in the absence of any relevant economic data from the US. Nevertheless, the fundamental backdrop seems tilted firmly in favour of bearish traders and suggests that the path of least resistance for the AUD/USD pair is to the downside.
Technical Levels: Supports and Resistances
AUDUSD currently trading at 0.6405 at the time of writing. Pair opened at 0.6404 and is trading with a change of 0.02 % .
| Overview | Overview.1 | |
|---|---|---|
| 0 | Today last price | 0.6405 |
| 1 | Today Daily Change | 0.0001 |
| 2 | Today Daily Change % | 0.0200 |
| 3 | Today daily open | 0.6404 |
The pair remains strongly bearish on the daily time frame. It trades below the 20 SMA @ 0.659, 50 SMA 0.6682, 100 SMA @ 0.6672 and 200 SMA @ 0.6736.
| Trends | Trends.1 | |
|---|---|---|
| 0 | Daily SMA20 | 0.6590 |
| 1 | Daily SMA50 | 0.6682 |
| 2 | Daily SMA100 | 0.6672 |
| 3 | Daily SMA200 | 0.6736 |
The previous day high was 0.645 while the previous day low was 0.6364. The daily 38.2% Fib levels comes at 0.6397, expected to provide support. Similarly, the daily 61.8% fib level is at 0.6418, expected to provide resistance.
Note the levels of interest below:
- Pivot support is noted at 0.6362, 0.632, 0.6276
- Pivot resistance is noted at 0.6448, 0.6492, 0.6534
| Levels | Levels.1 |
|---|---|
| Previous Daily High | 0.6450 |
| Previous Daily Low | 0.6364 |
| Previous Weekly High | 0.6617 |
| Previous Weekly Low | 0.6486 |
| Previous Monthly High | 0.6895 |
| Previous Monthly Low | 0.6599 |
| Daily Fibonacci 38.2% | 0.6397 |
| Daily Fibonacci 61.8% | 0.6418 |
| Daily Pivot Point S1 | 0.6362 |
| Daily Pivot Point S2 | 0.6320 |
| Daily Pivot Point S3 | 0.6276 |
| Daily Pivot Point R1 | 0.6448 |
| Daily Pivot Point R2 | 0.6492 |
| Daily Pivot Point R3 | 0.6534 |
[/s2If]
Download Nehcap EAWe have two EAs that are operational on our LIVE accounts.
- EA-FIX: Check out the details here. Download EA-FIX . EA-FIX is a non-grid HFT scalper.
- EA-GROWTH: High quality low dd EA using trend grids. Download EA_GROWTHJoin Our Telegram Group
")


