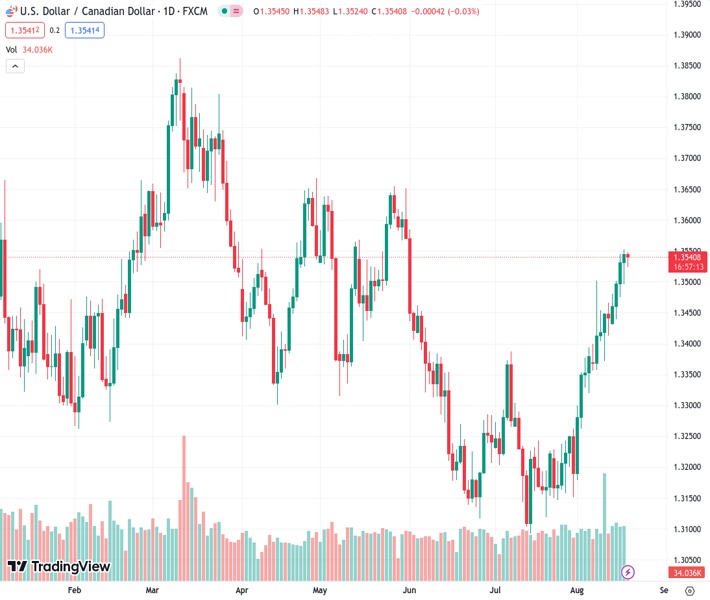
Since August 10, the USDCAD pair has been trading within an ascending trend-channel on the one-hour chart at a price of 1.35430.
…
This is a premium post.
[s2If !current_user_can(access_s2member_level4)]Please register for FREE REGISTER to read full post below containing analysis. In case of any error or you think you are not able to read the full post below, please email us at support#nehcap.com [lwa][/s2If] [s2If current_user_can(access_s2member_level1)]
- USD/CAD pair trades within the ascending trend-channel since August 10 on the one-hour chart.
The pair currently trades last at 1.35430.
The previous day high was 1.3553 while the previous day low was 1.3496. The daily 38.2% Fib levels comes at 1.3531, expected to provide support. Similarly, the daily 61.8% fib level is at 1.3518, expected to provide support.
The USD/CAD pair gains traction and holds above the 1.3540 area heading into the early European session on Friday. The major pair currently trades around 1.3544, down 0.01% on the day.
That said, the US data strengthen the case for another interest rate rise by the Federal Reserve (Fed). FOMC Minutes emphasized on Wednesday that inflation remained unacceptably high and it may need additional tightening of monetary policy to bring inflation to the longer-run target. This, in turn, boosts the US dollar against its rivals.
Additionally, the safe-haven Greenback attracts some buyers due to the fear of a potential Chinese property catastrophe. According to Reuters, Evergrande, China’s second-largest real estate company filed for bankruptcy in a US court under Chapter 15 on Thursday. It should be noted that Evergrande is the world’s most indebted property developer and has become the face of China’s property crisis.
Technically, the USD/CAD pair trades within the ascending trend-channel since August 10. Further upside for USD/CAD looks favorable as the pair holds above the 50- and 100-hour Exponential Moving Averages (EMAs) with an upward slope on the one-hour chart. Meanwhile, the Relative Strength Index (RSI) stands above 50, activating the bullish momentum for the USD/CAD pair for the time being.
The immediate resistance level for USD/CAD is seen at 1.3550 (High of August 17). The next barrier to watch is the upper boundary of the ascending trend-channel at 1.3570. Any follow-through buying above the latter will see a rally to 1.3600 (a psychological round mark), followed by 1.3640 (High of May 25).
Looking at the downside, 1.3520 is seen as an initial support level for USD/CAD. The critical contention level is located at 1.3500, highlighting the 100-hour EMA, psychological round figure, and the lower limit of the ascending trend-channel. Further south, the next stop to watch is at 1.3475 (Low of August 16) en route to 1.3445 (Low of August 15) and finally at 1.3410 (Low of August 11).
Technical Levels: Supports and Resistances
USDCAD currently trading at 1.3538 at the time of writing. Pair opened at 1.3545 and is trading with a change of -0.05 % .
| Overview | Overview.1 | |
|---|---|---|
| 0 | Today last price | 1.3538 |
| 1 | Today Daily Change | -0.0007 |
| 2 | Today Daily Change % | -0.0500 |
| 3 | Today daily open | 1.3545 |
The pair remains strongly bullish on the daily timeframe. It trades above its 20 SMA @ 1.3347, 50 SMA 1.3278, 100 SMA @ 1.3384 and 200 SMA @ 1.3452.
| Trends | Trends.1 | |
|---|---|---|
| 0 | Daily SMA20 | 1.3347 |
| 1 | Daily SMA50 | 1.3278 |
| 2 | Daily SMA100 | 1.3384 |
| 3 | Daily SMA200 | 1.3452 |
The previous day high was 1.3553 while the previous day low was 1.3496. The daily 38.2% Fib levels comes at 1.3531, expected to provide support. Similarly, the daily 61.8% fib level is at 1.3518, expected to provide support.
Note the levels of interest below:
- Pivot support is noted at 1.351, 1.3475, 1.3454
- Pivot resistance is noted at 1.3567, 1.3588, 1.3623
| Levels | Levels.1 |
|---|---|
| Previous Daily High | 1.3553 |
| Previous Daily Low | 1.3496 |
| Previous Weekly High | 1.3502 |
| Previous Weekly Low | 1.3356 |
| Previous Monthly High | 1.3387 |
| Previous Monthly Low | 1.3093 |
| Daily Fibonacci 38.2% | 1.3531 |
| Daily Fibonacci 61.8% | 1.3518 |
| Daily Pivot Point S1 | 1.3510 |
| Daily Pivot Point S2 | 1.3475 |
| Daily Pivot Point S3 | 1.3454 |
| Daily Pivot Point R1 | 1.3567 |
| Daily Pivot Point R2 | 1.3588 |
| Daily Pivot Point R3 | 1.3623 |
[/s2If]
Download Nehcap EAWe have two EAs that are operational on our LIVE accounts.
- EA-FIX: Check out the details here. Download EA-FIX . EA-FIX is a non-grid HFT scalper.
- EA-GROWTH: High quality low dd EA using trend grids. Download EA_GROWTHJoin Our Telegram Group
")


