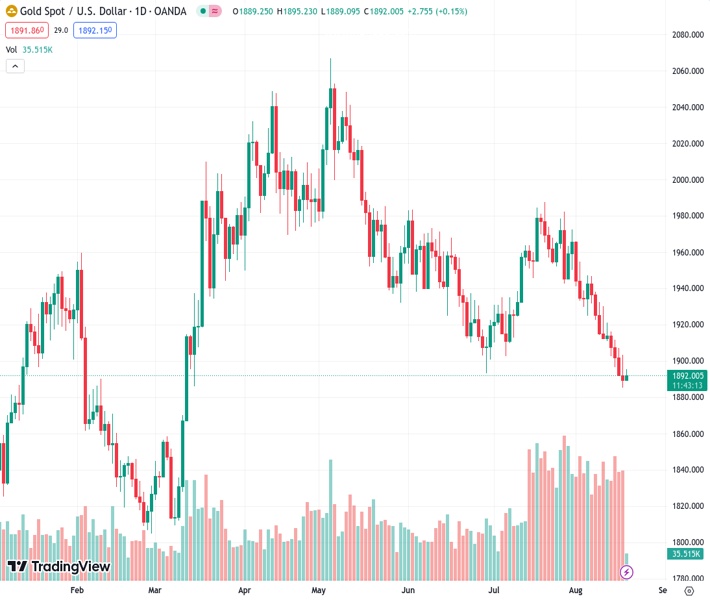
Gold price at 1,892.06 USD per ounce gained interest from buyers on Friday, ending a four-day decline to reach its lowest point in several months.
…
This is a premium post.
[s2If !current_user_can(access_s2member_level4)]Please register for FREE REGISTER to read full post below containing analysis. In case of any error or you think you are not able to read the full post below, please email us at support#nehcap.com [lwa][/s2If] [s2If current_user_can(access_s2member_level1)]
- Gold price attracts some buyers on Friday and snaps a four-day losing streak to a multi-month low.
The pair currently trades last at 1892.06.
The previous day high was 1903.61 while the previous day low was 1885.13. The daily 38.2% Fib levels comes at 1892.19, expected to provide resistance. Similarly, the daily 61.8% fib level is at 1896.55, expected to provide resistance.
Gold price gains some positive traction on Friday and for now, seems to have snapped a four-day losing streak to its lowest level since March 13, around the $1,885 region touched the previous day. The XAU/USD maintains its bid tone through the early part of the European session and currently trades just above the $1,890 level, up around 0.30% for the day. The intraday uptick, however, lacks bullish conviction, warranting some caution before positioning for any meaningful recovery move.
China Evergrande Group – one of the country’s biggest real estate developers – has filed for protection from creditors in a US bankruptcy court. This adds to concerns about a deepening crisis in China’s property sector and the worsening conditions in the world’s second-largest economy, which forces investors to take refuge in traditional safe-haven assets. The global flight to safety, meanwhile, drags the US Treasury bond yields lower and turns out to be another factor that benefits the non-yielding Gold price.
In fact, the yield on the benchmark 10-year US government bond corrects sharply from a 10-month peak touched the previous day, though the prospects for further policy tightening by the Federal Reserve (Fed) should help limit the downside. In fact, the minutes of the last Federal Open Market Committee (FOMC) meeting held on July 25-26 supported prospects for higher-for-longer interest rates in the United States (US) and kept the door open for one more 25 basis point (bps) lift-off later this year.
Moreover, the incoming US macro data continues to point to an extremely resilient economy, which should allow the Fed to stick to its hawkish stance. This, in turn, assists the US Dollar (USD) to stand tall near its highest level in more than two months and further contributes to keeping a lid on the Gold price. this further makes it prudent to wait for strong follow-through buying before confirming that the US Dollar-denominated commodity has formed a near-term bottom and placing aggressive bullish bets.
Traders also seem reluctant and might now prefer to move to the sidelines ahead of the crucial Jackson Hole Symposium next week, where comments by central bankers might infuse significant volatility in the markets. In the meantime, the US bond yields will play a key role in influencing the USD price dynamics in the absence of any relevant economic data from the US. Apart from this, the broader risk sentiment should allow traders to grab short-term opportunities around the Gold price on the last day of the week.
Technical Levels: Supports and Resistances
XAUUSD currently trading at 1892.09 at the time of writing. Pair opened at 1889.36 and is trading with a change of 0.14 % .
| Overview | Overview.1 | |
|---|---|---|
| 0 | Today last price | 1892.09 |
| 1 | Today Daily Change | 2.73 |
| 2 | Today Daily Change % | 0.14 |
| 3 | Today daily open | 1889.36 |
The pair remains strongly bearish on the daily time frame. It trades below the 20 SMA @ 1933.62, 50 SMA 1936.57, 100 SMA @ 1963.57 and 200 SMA @ 1906.05.
| Trends | Trends.1 | |
|---|---|---|
| 0 | Daily SMA20 | 1933.62 |
| 1 | Daily SMA50 | 1936.57 |
| 2 | Daily SMA100 | 1963.57 |
| 3 | Daily SMA200 | 1906.05 |
The previous day high was 1903.61 while the previous day low was 1885.13. The daily 38.2% Fib levels comes at 1892.19, expected to provide resistance. Similarly, the daily 61.8% fib level is at 1896.55, expected to provide resistance.
Note the levels of interest below:
- Pivot support is noted at 1881.79, 1874.22, 1863.31
- Pivot resistance is noted at 1900.27, 1911.18, 1918.75
| Levels | Levels.1 |
|---|---|
| Previous Daily High | 1903.61 |
| Previous Daily Low | 1885.13 |
| Previous Weekly High | 1946.82 |
| Previous Weekly Low | 1910.92 |
| Previous Monthly High | 1987.54 |
| Previous Monthly Low | 1902.77 |
| Daily Fibonacci 38.2% | 1892.19 |
| Daily Fibonacci 61.8% | 1896.55 |
| Daily Pivot Point S1 | 1881.79 |
| Daily Pivot Point S2 | 1874.22 |
| Daily Pivot Point S3 | 1863.31 |
| Daily Pivot Point R1 | 1900.27 |
| Daily Pivot Point R2 | 1911.18 |
| Daily Pivot Point R3 | 1918.75 |
[/s2If]
Download Nehcap EAWe have two EAs that are operational on our LIVE accounts.
- EA-FIX: Check out the details here. Download EA-FIX . EA-FIX is a non-grid HFT scalper.
- EA-GROWTH: High quality low dd EA using trend grids. Download EA_GROWTHJoin Our Telegram Group
")


