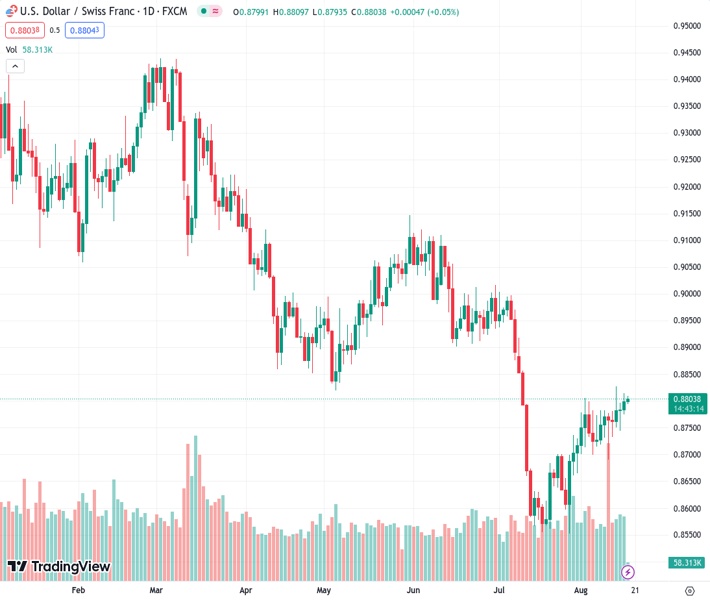
The USDCHF pair, currently trading at 0.88020, is experiencing limited movements and holding within a small price range, with slight profits above the 0.8800 level.
…
This is a premium post.
[s2If !current_user_can(access_s2member_level4)]Please register for FREE REGISTER to read full post below containing analysis. In case of any error or you think you are not able to read the full post below, please email us at support#nehcap.com [lwa][/s2If] [s2If current_user_can(access_s2member_level1)]
- USD/CHF remains confined in a narrow range with mild gains above the 0.8800 area.
The pair currently trades last at 0.88020.
The previous day high was 0.8814 while the previous day low was 0.8774. The daily 38.2% Fib levels comes at 0.8799, expected to provide support. Similarly, the daily 61.8% fib level is at 0.879, expected to provide support.
The USD/CHF pair trades flat with mild gains above the 0.8800 area heading into the early European session on Thursday. The pair has been trading within a consolidation phase since July 27.
That said, the upbeat US data and the possibility of a further tightening cycle from the Federal Reserve (Fed) are the main drivers of the US Dollar’s (USD) strength and boost USD/CHF higher. The Federal Open Market Committee (FOMC) Minutes emphasised that inflation remained unacceptably high while Fed officials opened the door for additional tightening of monetary policy to bring inflation to the longer-run target.
From the technical perspective, USD/CHF holds above the 50- and 100-hour Exponential Moving Averages (EMAs) with an upward slope, which means the path of least resistance for the pair is to the upside. Additionally, the Relative Strength Index (RSI) stands above 50, while the Moving Average Convergence/Divergence (MACD) holds above bullish territory, supporting the buyers for the time being.
The immediate resistance level for USD/CHF will emerge at 0.8830 (high of August 14). The additional upside filter is located at 0.8875 (high of July 7) en route to a psychological round mark at 0.8900. A break above the latter will see the next barrier at 0.8920 (high of July 10).
Looking at the downside, 0.8770 acts as an initial support level for the pair, portraying the 50-hour EMA and a low of August 15. Further south, the next stop of the USD/CHF pair is located at 0.8755 (the 100-hour EMA, a low of August 11). Any intraday pullback below the latter would expose the next critical contention level at 0.8700. The mentioned level represents a low of August 4 and a psychological round figure. The next downside stop emerged at 0.8665 (low of July 31).
Technical Levels: Supports and Resistances
USDCHF currently trading at 0.8807 at the time of writing. Pair opened at 0.88 and is trading with a change of 0.08 % .
| Overview | Overview.1 | |
|---|---|---|
| 0 | Today last price | 0.8807 |
| 1 | Today Daily Change | 0.0007 |
| 2 | Today Daily Change % | 0.0800 |
| 3 | Today daily open | 0.8800 |
The pair is trading above its 20 Daily moving average @ 0.8727, below its 50 Daily moving average @ 0.8825 , below its 100 Daily moving average @ 0.891 and below its 200 Daily moving average @ 0.9107
| Trends | Trends.1 | |
|---|---|---|
| 0 | Daily SMA20 | 0.8727 |
| 1 | Daily SMA50 | 0.8825 |
| 2 | Daily SMA100 | 0.8910 |
| 3 | Daily SMA200 | 0.9107 |
The previous day high was 0.8814 while the previous day low was 0.8774. The daily 38.2% Fib levels comes at 0.8799, expected to provide support. Similarly, the daily 61.8% fib level is at 0.879, expected to provide support.
Note the levels of interest below:
- Pivot support is noted at 0.8778, 0.8756, 0.8738
- Pivot resistance is noted at 0.8818, 0.8836, 0.8858
| Levels | Levels.1 |
|---|---|
| Previous Daily High | 0.8814 |
| Previous Daily Low | 0.8774 |
| Previous Weekly High | 0.8783 |
| Previous Weekly Low | 0.8690 |
| Previous Monthly High | 0.9005 |
| Previous Monthly Low | 0.8552 |
| Daily Fibonacci 38.2% | 0.8799 |
| Daily Fibonacci 61.8% | 0.8790 |
| Daily Pivot Point S1 | 0.8778 |
| Daily Pivot Point S2 | 0.8756 |
| Daily Pivot Point S3 | 0.8738 |
| Daily Pivot Point R1 | 0.8818 |
| Daily Pivot Point R2 | 0.8836 |
| Daily Pivot Point R3 | 0.8858 |
[/s2If]
Download Nehcap EAWe have two EAs that are operational on our LIVE accounts.
- EA-FIX: Check out the details here. Download EA-FIX . EA-FIX is a non-grid HFT scalper.
- EA-GROWTH: High quality low dd EA using trend grids. Download EA_GROWTHJoin Our Telegram Group
")


