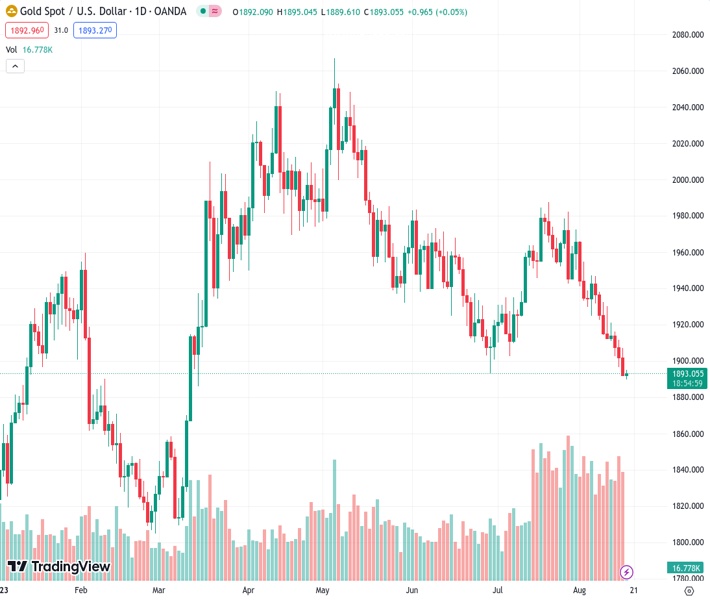
The price of gold, denoted as XAUUSD, has reached a new low in several months due to the influence of a slightly stronger US Dollar.
…
This is a premium post.
[s2If !current_user_can(access_s2member_level4)]Please register for FREE REGISTER to read full post below containing analysis. In case of any error or you think you are not able to read the full post below, please email us at support#nehcap.com [lwa][/s2If] [s2If current_user_can(access_s2member_level1)]
- Gold price touches a fresh multi-month low and is pressured by modest US Dollar strength.
The pair currently trades last at 1892.75.
The previous day high was 1907.27 while the previous day low was 1891.68. The daily 38.2% Fib levels comes at 1897.64, expected to provide resistance. Similarly, the daily 61.8% fib level is at 1901.31, expected to provide resistance.
Gold price struggles to gain any meaningful traction on Thursday and languishes near its lowest level since mid-March touched during the Asian session. The XAU/USD currently trades around the $1,890 level and seems vulnerable in the wake of the overnight bearish break through the very important 200-day Simple Moving Average (SMA) for the first time since November 2022.
The US Dollar (USD) prolongs its recent upward trajectory witnessed over the past month or so and remains well supported by the Federal Reserve’s (Fed) hawkish outlook, which is seen as a key factor acting as a headwind for the Gold price. In fact, the minutes of the July 25-26 Federal Open Market Committee (FOMC) policy meeting revealed that policymakers remained divided over the need for more rate hikes, though continued to prioritize the battle against inflation. It is worth recalling that the United States (US) Consumer Price Index (CPI) showed a moderate rise in consumer prices in July. Moreover, the US Producer Price Index (PPI) climbed slightly more than expected last month and suggested that the battle to bring inflation back to the Fed’s 2% target is far from being won.
Adding to this, the upbeat US Retail Sales data released earlier this week indicated that consumer spending held up well in July. Furthermore, the incoming stronger US macro data, including Housing Starts and Industrial Production figures on Wednesday, points to an extremely resilient economy and keeps the door for a further rate hike later this year wide open. This, in turn, remains supportive of a further rise in the US Treasury bond yields and turns out to be another factor that contributes to capping the upside for the non-yielding Gold price. In fact, the yield on the benchmark 10-year US government bond touched its highest level since 2008 and lifts the USD to a two-and-half-month peak, which tends to dent demand for the US Dollar-denominated commodities like the XAU/USD.
The prospects for further policy tightening by the Fed, meanwhile, add to worries about economic headwinds stemming from rising borrowing costs. This, along with growing concerns about the worsening economic conditions in China, tempers investors’ appetite for riskier assets. The anti-risk flow is evident from a generally weaker tone around the equity markets, which is holding back traders from placing aggressive bearish bets around the safe-haven Gold price. This seems to be the only factor helping limit the downside, though the aforementioned fundamental backdrop and acceptance below a technically significant 200-day SMA suggest that the path of least resistance for the XAU/USD is to the downside. Hence, any attempted recovery might still be seen as a selling opportunity.
Technical Levels: Supports and Resistances
XAUUSD currently trading at 1890.2 at the time of writing. Pair opened at 1891.76 and is trading with a change of -0.08 % .
| Overview | Overview.1 | |
|---|---|---|
| 0 | Today last price | 1890.20 |
| 1 | Today Daily Change | -1.56 |
| 2 | Today Daily Change % | -0.08 |
| 3 | Today daily open | 1891.76 |
The pair remains strongly bearish on the daily time frame. It trades below the 20 SMA @ 1937.62, 50 SMA 1938.09, 100 SMA @ 1964.32 and 200 SMA @ 1905.12.
| Trends | Trends.1 | |
|---|---|---|
| 0 | Daily SMA20 | 1937.62 |
| 1 | Daily SMA50 | 1938.09 |
| 2 | Daily SMA100 | 1964.32 |
| 3 | Daily SMA200 | 1905.12 |
The previous day high was 1907.27 while the previous day low was 1891.68. The daily 38.2% Fib levels comes at 1897.64, expected to provide resistance. Similarly, the daily 61.8% fib level is at 1901.31, expected to provide resistance.
Note the levels of interest below:
- Pivot support is noted at 1886.54, 1881.31, 1870.95
- Pivot resistance is noted at 1902.13, 1912.49, 1917.72
| Levels | Levels.1 |
|---|---|
| Previous Daily High | 1907.27 |
| Previous Daily Low | 1891.68 |
| Previous Weekly High | 1946.82 |
| Previous Weekly Low | 1910.92 |
| Previous Monthly High | 1987.54 |
| Previous Monthly Low | 1902.77 |
| Daily Fibonacci 38.2% | 1897.64 |
| Daily Fibonacci 61.8% | 1901.31 |
| Daily Pivot Point S1 | 1886.54 |
| Daily Pivot Point S2 | 1881.31 |
| Daily Pivot Point S3 | 1870.95 |
| Daily Pivot Point R1 | 1902.13 |
| Daily Pivot Point R2 | 1912.49 |
| Daily Pivot Point R3 | 1917.72 |
[/s2If]
Download Nehcap EAWe have two EAs that are operational on our LIVE accounts.
- EA-FIX: Check out the details here. Download EA-FIX . EA-FIX is a non-grid HFT scalper.
- EA-GROWTH: High quality low dd EA using trend grids. Download EA_GROWTHJoin Our Telegram Group
")


