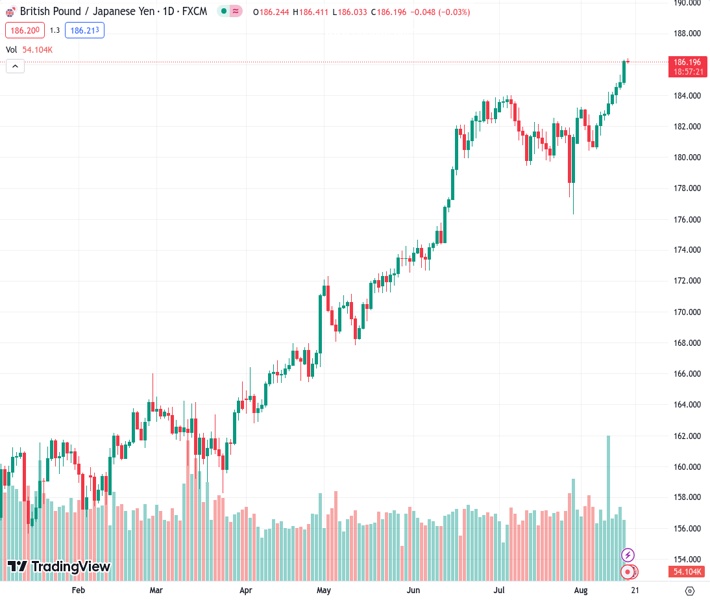
The GBPJPY pair hit a record high at 186.203 due to positive UK inflation data that exceeded expectations.
…
This is a premium post.
[s2If !current_user_can(access_s2member_level4)]Please register for FREE REGISTER to read full post below containing analysis. In case of any error or you think you are not able to read the full post below, please email us at support#nehcap.com [lwa][/s2If] [s2If current_user_can(access_s2member_level1)]
- GBP/JPY achieved a historical peak on the back of better-than-expected UK inflation data.
The pair currently trades last at 186.203.
The previous day high was 186.35 while the previous day low was 184.7. The daily 38.2% Fib levels comes at 185.72, expected to provide support. Similarly, the daily 61.8% fib level is at 185.33, expected to provide support.
GBP/JPY achieved a historical peak of 186.41 during the early trading hours in the Asian session on Thursday. Currently, the pair hovers around 186.20 as it seeks to extend its ongoing winning streak. The British Pound (GBP) is showing strength against the Japanese Yen (JPY), primarily driven by better-than-expected inflation figures originating from the United Kingdom (UK) on Wednesday.
This resilient economic data could amplify the concerns over interest rate hikes by the Bank of England (BoE) in the September meeting. That said, UK Consumer Price Index (CPI) (MoM) printed the figure of -0.4% for the month of July against the expected -0.5% and 0.1% prior. At the annual rate, the CPI posted a reading of 6.8% same as anticipated, against the 7.9% previously. Core CPI remained consistent at the rate of 6.9%, against the expected 6.8%.
On the other hand, the Reuters Tankan, a quarterly survey outlining the business sentiment among Japanese companies, was revealed on Wednesday. This dataset contributed to the strength of the Japanese Yen (JPY) as it indicated improvements in both Large Manufacturing and Non-manufacturing sentiments. Additionally, there is ongoing market speculation concerning the potential intervention by Japanese authorities to protect the Japanese currency from further appreciation against the US Dollar (USD). Such intervention could significantly impact the price movement of GBP/JPY, influencing its overall price action.
Furthermore, the moderate trade data released from Japan on Thursday might serve as a limiting factor, potentially capping the upward movement of the GBP/JPY pair. Japan’s year-on-year exports experienced a contraction, with the reading declining to -0.3% from the previous 1.5% in July. This result was better than the projected decline of -0.8%. At the same time, year-on-year imports also declined, reaching -13.5% in July. This figure was slightly better than the expected reading of -14.7%, representing a decrease from the previous reading of -12.9%.
Market participants will closely observe the upcoming data release scheduled for Friday. In the Japanese economic calendar, particular attention will be directed toward the National Consumer Price Index. Likewise, there will be a focus on Retail Sales data from the UK. These data releases are expected to offer valuable insights into the economic outlook of Japan and the UK, potentially influencing trading decisions involving the GBP/JPY pair.
Technical Levels: Supports and Resistances
GBPJPY currently trading at 186.21 at the time of writing. Pair opened at 186.33 and is trading with a change of -0.06 % .
| Overview | Overview.1 | |
|---|---|---|
| 0 | Today last price | 186.21 |
| 1 | Today Daily Change | -0.12 |
| 2 | Today Daily Change % | -0.06 |
| 3 | Today daily open | 186.33 |
The pair remains strongly bullish on the daily timeframe. It trades above its 20 SMA @ 182.41, 50 SMA 181.55, 100 SMA @ 175.37 and 200 SMA @ 168.87.
| Trends | Trends.1 | |
|---|---|---|
| 0 | Daily SMA20 | 182.41 |
| 1 | Daily SMA50 | 181.55 |
| 2 | Daily SMA100 | 175.37 |
| 3 | Daily SMA200 | 168.87 |
The previous day high was 186.35 while the previous day low was 184.7. The daily 38.2% Fib levels comes at 185.72, expected to provide support. Similarly, the daily 61.8% fib level is at 185.33, expected to provide support.
Note the levels of interest below:
- Pivot support is noted at 185.24, 184.14, 183.58
- Pivot resistance is noted at 186.89, 187.45, 188.54
| Levels | Levels.1 |
|---|---|
| Previous Daily High | 186.35 |
| Previous Daily Low | 184.70 |
| Previous Weekly High | 184.25 |
| Previous Weekly Low | 180.58 |
| Previous Monthly High | 184.02 |
| Previous Monthly Low | 176.32 |
| Daily Fibonacci 38.2% | 185.72 |
| Daily Fibonacci 61.8% | 185.33 |
| Daily Pivot Point S1 | 185.24 |
| Daily Pivot Point S2 | 184.14 |
| Daily Pivot Point S3 | 183.58 |
| Daily Pivot Point R1 | 186.89 |
| Daily Pivot Point R2 | 187.45 |
| Daily Pivot Point R3 | 188.54 |
[/s2If]
Download Nehcap EAWe have two EAs that are operational on our LIVE accounts.
- EA-FIX: Check out the details here. Download EA-FIX . EA-FIX is a non-grid HFT scalper.
- EA-GROWTH: High quality low dd EA using trend grids. Download EA_GROWTHJoin Our Telegram Group
")


