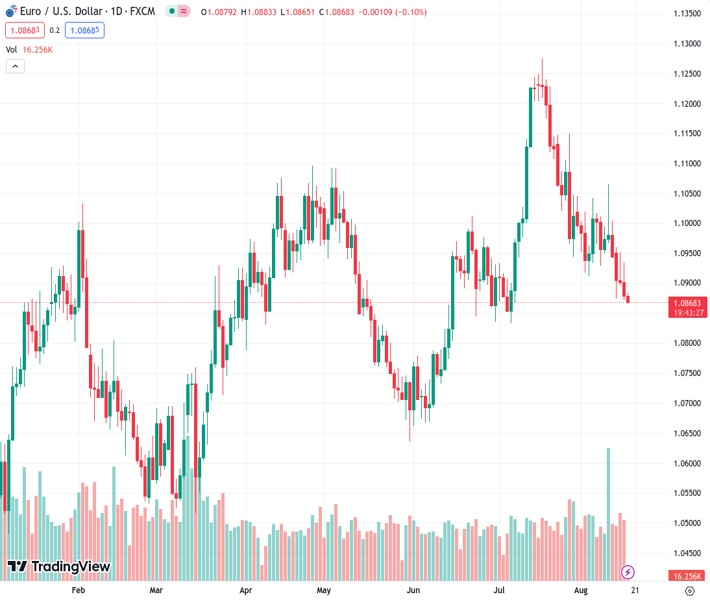
The EURUSD currency pair drops to a six-week low of 1.08653 as the US Dollar strengthens following the release of the FOMC Minutes. Analysis suggests that the downside movement is expected to be limited.
…
This is a premium post.
[s2If !current_user_can(access_s2member_level4)]Please register for FREE REGISTER to read full post below containing analysis. In case of any error or you think you are not able to read the full post below, please email us at support#nehcap.com [lwa][/s2If] [s2If current_user_can(access_s2member_level1)]
- EUR/USD takes offers to refresh six-week low as US Dollar extends FOMC Minutes inspired gains.
The pair currently trades last at 1.08653.
The previous day high was 1.0934 while the previous day low was 1.0872. The daily 38.2% Fib levels comes at 1.0896, expected to provide resistance. Similarly, the daily 61.8% fib level is at 1.091, expected to provide resistance.
EUR/USD slides to the fresh low since early July as US Dollar extends the latest run-up during early Thursday. In doing so, the Euro pair drops for the second consecutive day to 1.0866, refreshing the 1.5-month low amid market’s risk-off mood and the firmer US Treasury bond yields.
Also read: EUR/USD licks its wounds at six-week low under 1.0900 as Fed minutes, yields propel US Dollar
Technically, the EUR/USD pair’s sustained trading below the 200-SMA, as well as the previous support line stretched from late May, joins the bearish MACD signals to suggest the major currency pair’s further downside.
However, the oversold RSI (14) line joins a two-month-old horizontal support zone and a descending support line from July 28 to highlight 1.0845-35 as the short-term key support for the pair bears to watch.
In a case where the Euro pair drops below 1.0835, the early June swing high around 1.0780 may act as an intermediate halt for the pair’s fall toward May’s bottom surrounding 1.0635.
On the flip side, the latest swing high of around 1.0930 and 1.1000 round figure may entertain the EUR/USD buyers during a corrective bounce.
However, a downward-sloping resistance line from July 18 and the 200-SMA, respectively near 1.1010 and 1.1025, can challenge the Euro pair’s further recovery.
It’s worth noting that the aforementioned support-turned-resistance line from late May, close to 1.1060 at the latest, acts as the final defense of the EUR/USD sellers.
Trend: Limited downside expected
Technical Levels: Supports and Resistances
EURUSD currently trading at 1.0871 at the time of writing. Pair opened at 1.0879 and is trading with a change of -0.07% % .
| Overview | Overview.1 | |
|---|---|---|
| 0 | Today last price | 1.0871 |
| 1 | Today Daily Change | -0.0008 |
| 2 | Today Daily Change % | -0.07% |
| 3 | Today daily open | 1.0879 |
The pair is trading below its 20 Daily moving average @ 1.0994, below its 50 Daily moving average @ 1.0973 , below its 100 Daily moving average @ 1.0931 and above its 200 Daily moving average @ 1.0785
| Trends | Trends.1 | |
|---|---|---|
| 0 | Daily SMA20 | 1.0994 |
| 1 | Daily SMA50 | 1.0973 |
| 2 | Daily SMA100 | 1.0931 |
| 3 | Daily SMA200 | 1.0785 |
The previous day high was 1.0934 while the previous day low was 1.0872. The daily 38.2% Fib levels comes at 1.0896, expected to provide resistance. Similarly, the daily 61.8% fib level is at 1.091, expected to provide resistance.
Note the levels of interest below:
- Pivot support is noted at 1.0856, 1.0832, 1.0793
- Pivot resistance is noted at 1.0919, 1.0958, 1.0982
| Levels | Levels.1 |
|---|---|
| Previous Daily High | 1.0934 |
| Previous Daily Low | 1.0872 |
| Previous Weekly High | 1.1065 |
| Previous Weekly Low | 1.0929 |
| Previous Monthly High | 1.1276 |
| Previous Monthly Low | 1.0834 |
| Daily Fibonacci 38.2% | 1.0896 |
| Daily Fibonacci 61.8% | 1.0910 |
| Daily Pivot Point S1 | 1.0856 |
| Daily Pivot Point S2 | 1.0832 |
| Daily Pivot Point S3 | 1.0793 |
| Daily Pivot Point R1 | 1.0919 |
| Daily Pivot Point R2 | 1.0958 |
| Daily Pivot Point R3 | 1.0982 |
[/s2If]
Download Nehcap EAWe have two EAs that are operational on our LIVE accounts.
- EA-FIX: Check out the details here. Download EA-FIX . EA-FIX is a non-grid HFT scalper.
- EA-GROWTH: High quality low dd EA using trend grids. Download EA_GROWTHJoin Our Telegram Group
")


