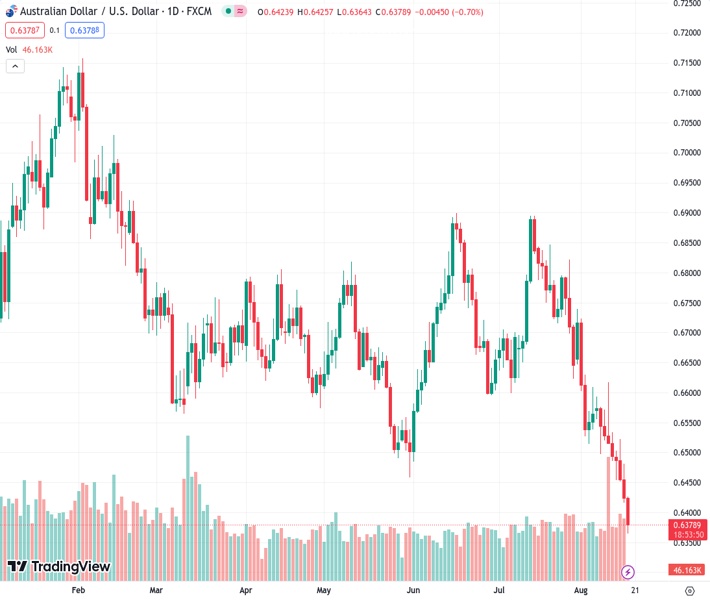
The AUDUSD pair, currently trading at 0.63818, continues its downward trend for the eighth day in a row following discouraging employment data in Australia for the month of July.
…
This is a premium post.
[s2If !current_user_can(access_s2member_level4)]Please register for FREE REGISTER to read full post below containing analysis. In case of any error or you think you are not able to read the full post below, please email us at support#nehcap.com [lwa][/s2If] [s2If current_user_can(access_s2member_level1)]
- AUD/USD drops for the eighth consecutive day after downbeat Australia job numbers for July.
The pair currently trades last at 0.63818.
The previous day high was 0.648 while the previous day low was 0.6416. The daily 38.2% Fib levels comes at 0.6441, expected to provide resistance. Similarly, the daily 61.8% fib level is at 0.6456, expected to provide resistance.
AUD/USD justifies downbeat Australian employment data, as well as the broad risk-off mood, by refreshing the Year-To-Date (YTD) low near 0.6370 during early Thursday. In doing so, the Aussie pair drops for the eighth consecutive day amid a broadly firmer US Dollar.
Australia’s headline Employment Change slumped to -14.6K for July on a seasonally adjusted basis versus 15.0K expected and 32.6K prior whereas the Unemployment Rate edges higher to 3.7% compared to the market’s expectations of once again witnessing 3.5% figure.
Apart from the mostly downbeat Aussie jobs report, economic concerns surrounding Australia’s biggest customer China and the recent hawkish Minutes of the Federal Open Market Committee’s (FOMC) July 25-26 meeting weigh on the AUD/USD prices.
That said, the latest Fed meeting minutes highlighted the policymakers’ discussion on the inflation pressure, despite marking a division on the rate hike decision. That said, the Minutes also conveyed that most policymakers preferred supporting the battle again the ‘sticky’ inflation.
Not only the hawkish Fed Minutes but the mostly upbeat US data and firmer US Treasury bond yields also inspire the AUD/USD bears. On Wednesday, the US Industrial Production marked a surprise 1.0% growth for July versus 0.3% expected and -0.8% prior while the Capacity Utilization for the said month also improved to 79.3% from 78.6%, compared to market forecasts of 79.1%. Further, the Building Permits edged higher to 1.442M for July from 1.441M whereas the Housing Starts rose to 1.452M for the said month versus 1.398M prior and 1.448M expected. It’s worth noting that both the Building Permits Change and Housing Starts Change improved more than market forecasts and previous readings. Previously, the US Retail Sales grew 0.7% MoM in July versus the 0.4% expected and 0.3% reported in June (revised from 0.2%) and suggested strong consumer spending, mainly due to improved wages, which in turn favored the Greenback to stay firmer during early weekdays.
At home, Australia’s Westpac Leading Index slid to -0.02% MoM for July from a downwardly revised prior of 0.07%. Further, China’s Housing Price Index dropped to -0.1% for July from 0.0% prior.
On a different page, a slump in China’s housing prices, triggered in June joins the fears about another bond market crisis in the Dragon Nation as the biggest private realtor Country Garden struggles to pay bond payments. It should be observed that the Chinese policymakers have been trying by all means to defy the concerns about easing economic recovery but no meaningful market reaction has been witnessed of late, which in turn flags concerns about the recession of the world’s second-largest economy and weighs on the AUD/USD price.
Additionally weakening the sentiment and the AUD/USD price is the news that the global rating agency Fitch Ratings lowered medium-term Gross Domestic Product (GDP) projections for 10 developed economies in its quarterly Global Economic Outlook.
Against this backdrop, Wall Street closed in the red while the US 10-year Treasury bond yields refreshed the yearly top to 4.278%. It should be noted that S&P500 Futures dropped to the lowest level in seven weeks by the press time and keep the Aussie bears hopeful of witnessing further downside.
Moving on, a light calendar may allow the Aussie bears to take a breather in case where any risk-positive headlines erupt. However, the downside bias isn’t likely to be reversed anytime soon. That said, the US weekly jobless claims and Philadelphia Fed Manufacturing Survey for August should also be watched for clear directions.
The AUD/USD pair’s sustained downside break of an ascending support line from November 2022, now resistance around 0.6490, directs bears toward the late 2022 swing low of around 0.6275.
Technical Levels: Supports and Resistances
AUDUSD currently trading at 0.6397 at the time of writing. Pair opened at 0.6424 and is trading with a change of -0.42% % .
| Overview | Overview.1 | |
|---|---|---|
| 0 | Today last price | 0.6397 |
| 1 | Today Daily Change | -0.0027 |
| 2 | Today Daily Change % | -0.42% |
| 3 | Today daily open | 0.6424 |
The pair remains strongly bearish on the daily time frame. It trades below the 20 SMA @ 0.6608, 50 SMA 0.6688, 100 SMA @ 0.6675 and 200 SMA @ 0.6737.
| Trends | Trends.1 | |
|---|---|---|
| 0 | Daily SMA20 | 0.6608 |
| 1 | Daily SMA50 | 0.6688 |
| 2 | Daily SMA100 | 0.6675 |
| 3 | Daily SMA200 | 0.6737 |
The previous day high was 0.648 while the previous day low was 0.6416. The daily 38.2% Fib levels comes at 0.6441, expected to provide resistance. Similarly, the daily 61.8% fib level is at 0.6456, expected to provide resistance.
Note the levels of interest below:
- Pivot support is noted at 0.64, 0.6375, 0.6335
- Pivot resistance is noted at 0.6464, 0.6505, 0.6529
| Levels | Levels.1 |
|---|---|
| Previous Daily High | 0.6480 |
| Previous Daily Low | 0.6416 |
| Previous Weekly High | 0.6617 |
| Previous Weekly Low | 0.6486 |
| Previous Monthly High | 0.6895 |
| Previous Monthly Low | 0.6599 |
| Daily Fibonacci 38.2% | 0.6441 |
| Daily Fibonacci 61.8% | 0.6456 |
| Daily Pivot Point S1 | 0.6400 |
| Daily Pivot Point S2 | 0.6375 |
| Daily Pivot Point S3 | 0.6335 |
| Daily Pivot Point R1 | 0.6464 |
| Daily Pivot Point R2 | 0.6505 |
| Daily Pivot Point R3 | 0.6529 |
[/s2If]
Download Nehcap EAWe have two EAs that are operational on our LIVE accounts.
- EA-FIX: Check out the details here. Download EA-FIX . EA-FIX is a non-grid HFT scalper.
- EA-GROWTH: High quality low dd EA using trend grids. Download EA_GROWTHJoin Our Telegram Group
")


