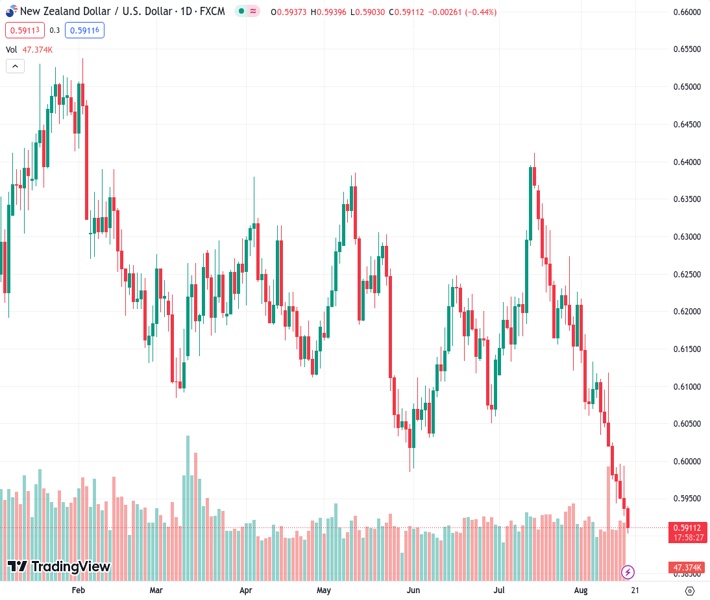
#NZDUSD @ 0.59100 experiences selling pressure to reach the lowest level of the year after a continuous decline of eight days. According to @nehcap’s opinion, there is not much room for the currency pair to decline further.
…
This is a premium post.
[s2If !current_user_can(access_s2member_level4)]Please register for FREE REGISTER to read full post below containing analysis. In case of any error or you think you are not able to read the full post below, please email us at support#nehcap.com [lwa][/s2If] [s2If current_user_can(access_s2member_level1)]
- NZD/USD takes offers to refresh yearly low during eight-day downtrend.
The pair currently trades last at 0.59100.
The previous day high was 0.5994 while the previous day low was 0.5926. The daily 38.2% Fib levels comes at 0.5952, expected to provide resistance. Similarly, the daily 61.8% fib level is at 0.5968, expected to provide resistance.
NZD/USD bears keep the reins for the eighth consecutive day as they refresh the yearly low to 0.5902 amid early Thursday.
In doing so, the Kiwi pair justifies the previous week’s downside break of the 0.5985 support comprising May’s low while poking the 61.8% Fibonacci retracement of October 2022 to February 2023 upside, near 0.5900 by the press time, also known as the golden Fibonacci ratio.
It’s worth noting, however, that the RSI (14) line hits the oversold territory and joins the key Fibonacci support around 0.5900 to challenge the NZD/USD bears.
Also acting as a downside filter is a descending support line from early March, close to 0.5885 by the press time.
In a case where the Kiwi pair drops below 0.5885, the early October swing high near 0.5815 may act as the final defense of the bulls.
Alternatively, an upside clearance of the support-turned-resistance line surrounding 0.5985, closely followed by the 0.6000 psychological magnet, becomes necessary for the NZD/USD buyers to return to the desk.
Even so, a downward-sloping resistance line from July 14, around 0.6045 at the latest, can challenge the run-up before pushing back the bears.
Trend: Limited downside expected
Technical Levels: Supports and Resistances
NZDUSD currently trading at 0.5914 at the time of writing. Pair opened at 0.5937 and is trading with a change of -0.39% % .
| Overview | Overview.1 | |
|---|---|---|
| 0 | Today last price | 0.5914 |
| 1 | Today Daily Change | -0.0023 |
| 2 | Today Daily Change % | -0.39% |
| 3 | Today daily open | 0.5937 |
The pair remains strongly bearish on the daily time frame. It trades below the 20 SMA @ 0.6103, 50 SMA 0.6158, 100 SMA @ 0.6176 and 200 SMA @ 0.6234.
| Trends | Trends.1 | |
|---|---|---|
| 0 | Daily SMA20 | 0.6103 |
| 1 | Daily SMA50 | 0.6158 |
| 2 | Daily SMA100 | 0.6176 |
| 3 | Daily SMA200 | 0.6234 |
The previous day high was 0.5994 while the previous day low was 0.5926. The daily 38.2% Fib levels comes at 0.5952, expected to provide resistance. Similarly, the daily 61.8% fib level is at 0.5968, expected to provide resistance.
Note the levels of interest below:
- Pivot support is noted at 0.5911, 0.5884, 0.5843
- Pivot resistance is noted at 0.5979, 0.602, 0.6047
| Levels | Levels.1 |
|---|---|
| Previous Daily High | 0.5994 |
| Previous Daily Low | 0.5926 |
| Previous Weekly High | 0.6118 |
| Previous Weekly Low | 0.5974 |
| Previous Monthly High | 0.6413 |
| Previous Monthly Low | 0.6120 |
| Daily Fibonacci 38.2% | 0.5952 |
| Daily Fibonacci 61.8% | 0.5968 |
| Daily Pivot Point S1 | 0.5911 |
| Daily Pivot Point S2 | 0.5884 |
| Daily Pivot Point S3 | 0.5843 |
| Daily Pivot Point R1 | 0.5979 |
| Daily Pivot Point R2 | 0.6020 |
| Daily Pivot Point R3 | 0.6047 |
[/s2If]
Download Nehcap EAWe have two EAs that are operational on our LIVE accounts.
- EA-FIX: Check out the details here. Download EA-FIX . EA-FIX is a non-grid HFT scalper.
- EA-GROWTH: High quality low dd EA using trend grids. Download EA_GROWTHJoin Our Telegram Group
")


