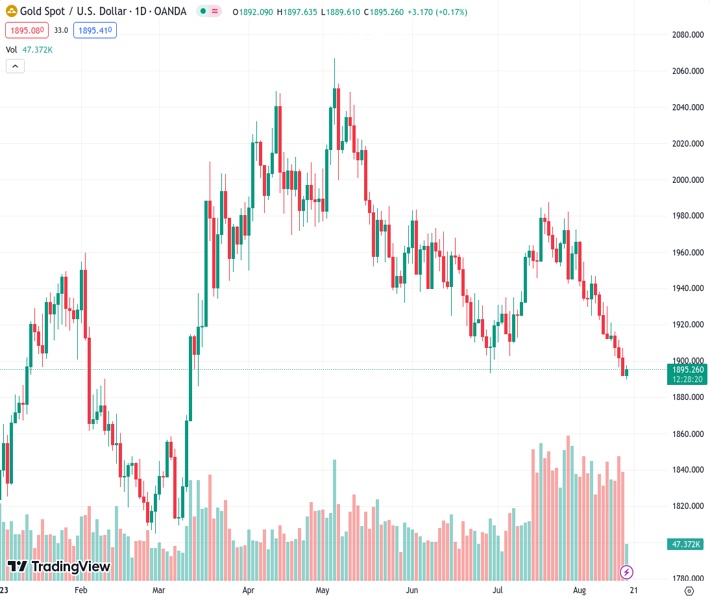
Gold is currently trading at $1,895.44 and remains close to the $1,900 mark as it awaits updates on the Federal Reserve’s policy.
…
This is a premium post.
[s2If !current_user_can(access_s2member_level4)]Please register for FREE REGISTER to read full post below containing analysis. In case of any error or you think you are not able to read the full post below, please email us at support#nehcap.com [lwa][/s2If] [s2If current_user_can(access_s2member_level1)]
- Gold price hovers near $1,900, awaiting fresh cues about Fed policy.
The pair currently trades last at 1895.44.
The previous day high was 1907.27 while the previous day low was 1891.68. The daily 38.2% Fib levels comes at 1897.64, expected to provide resistance. Similarly, the daily 61.8% fib level is at 1901.31, expected to provide resistance.
Gold price recovered its losses registered on Wednesday, currently trying to hold the ground near the $1,900 per troy ounce during the early trading hours in the European session on Thursday. The recent release of strong macroeconomic data from the United States (US) on Wednesday exerted downward pressure on the price of gold. Investors seek additional momentum from upcoming US economic indicators in order to gain a clearer perspective on the potential further tightening of monetary policy by the US Federal Reserve (Fed).
Wednesday’s US economic calendar included the release of the US Housing Starts (MoM) data for July, which increased to 1.452M from the previous month’s 1.398M. This exceeded the expected figure of 1.448M. Additionally, the Monthly Industrial Production rose of 1%, surpassing the projected growth of 0.3% and swinging from the previous month’s 0.8% decline. However, US Building Permits experienced a minor rise to 1.442 million in July from the prior 1.441 million, falling short of the anticipated 1.463 million.
Concerns about China’s deteriorating economic prospects could put pressure on Gold’s ability to sustain its value. Moreover, robust US economic performance triggered the US Treasury bond yields, bolstering the US Dollar (USD). This upward momentum in the USD could exert downward pressure on the price of Gold.
Investors will closely monitor upcoming US data releases, namely Initial Jobless Claims and the Philadelphia Fed Manufacturing Survey. These datasets could provide fresh insights into the overall US economic outlook, helping Gold traders in obtaining a clearer understanding of the market dynamics.
Technical Levels: Supports and Resistances
XAUUSD currently trading at 1896.51 at the time of writing. Pair opened at 1891.76 and is trading with a change of 0.25 % .
| Overview | Overview.1 | |
|---|---|---|
| 0 | Today last price | 1896.51 |
| 1 | Today Daily Change | 4.75 |
| 2 | Today Daily Change % | 0.25 |
| 3 | Today daily open | 1891.76 |
The pair remains strongly bearish on the daily time frame. It trades below the 20 SMA @ 1937.62, 50 SMA 1938.09, 100 SMA @ 1964.32 and 200 SMA @ 1905.12.
| Trends | Trends.1 | |
|---|---|---|
| 0 | Daily SMA20 | 1937.62 |
| 1 | Daily SMA50 | 1938.09 |
| 2 | Daily SMA100 | 1964.32 |
| 3 | Daily SMA200 | 1905.12 |
The previous day high was 1907.27 while the previous day low was 1891.68. The daily 38.2% Fib levels comes at 1897.64, expected to provide resistance. Similarly, the daily 61.8% fib level is at 1901.31, expected to provide resistance.
Note the levels of interest below:
- Pivot support is noted at 1886.54, 1881.31, 1870.95
- Pivot resistance is noted at 1902.13, 1912.49, 1917.72
| Levels | Levels.1 |
|---|---|
| Previous Daily High | 1907.27 |
| Previous Daily Low | 1891.68 |
| Previous Weekly High | 1946.82 |
| Previous Weekly Low | 1910.92 |
| Previous Monthly High | 1987.54 |
| Previous Monthly Low | 1902.77 |
| Daily Fibonacci 38.2% | 1897.64 |
| Daily Fibonacci 61.8% | 1901.31 |
| Daily Pivot Point S1 | 1886.54 |
| Daily Pivot Point S2 | 1881.31 |
| Daily Pivot Point S3 | 1870.95 |
| Daily Pivot Point R1 | 1902.13 |
| Daily Pivot Point R2 | 1912.49 |
| Daily Pivot Point R3 | 1917.72 |
[/s2If]
Download Nehcap EAWe have two EAs that are operational on our LIVE accounts.
- EA-FIX: Check out the details here. Download EA-FIX . EA-FIX is a non-grid HFT scalper.
- EA-GROWTH: High quality low dd EA using trend grids. Download EA_GROWTHJoin Our Telegram Group
")


