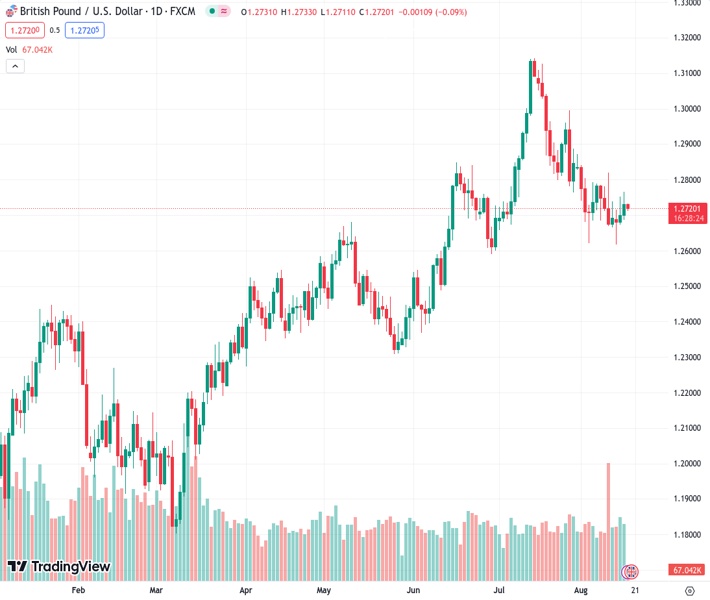
GBPUSD, trading at a rate of 1.27204, encountered a new influx of supply on Thursday and is facing downward pressure due to continued purchasing of the USD.
…
This is a premium post.
[s2If !current_user_can(access_s2member_level4)]Please register for FREE REGISTER to read full post below containing analysis. In case of any error or you think you are not able to read the full post below, please email us at support#nehcap.com [lwa][/s2If] [s2If current_user_can(access_s2member_level1)]
- GBP/USD meets with a fresh supply on Thursday and is pressured by sustained USD buying.
The pair currently trades last at 1.27204.
The previous day high was 1.2766 while the previous day low was 1.2687. The daily 38.2% Fib levels comes at 1.2736, expected to provide resistance. Similarly, the daily 61.8% fib level is at 1.2717, expected to provide support.
The GBP/USD pair edges lower during the Asian session on Thursday and extends the overnight pullback from the 1.2765 area, or a multi-day peak. The downtick is exclusively sponsored by the underlying bullish sentiment surrounding the US Dollar (USD), though spot prices manage to hold above the 1.2700 mark in the wake of rising bets for further interest rate hikes by the Bank of England (BoE).
The USD Index (DXY), which tracks the Greenback against a basket of currencies, climbs to its highest level since June 12 and is supported by the Federal Reserve’s (Fed) hawkish outlook. the In fact, the minutes of the July 25-26 FOMC meeting released on Wednesday revealed that policymakers were divided over the need for more rate hikes, though continued to prioritize the battle against inflation. Moreover, the incoming stronger US macro data points to an extremely resilient economy and keeps the door open for one more 25 bps lift-off later this year.
The outlook pushes the yield in the benchmark 10-year US government bond to its highest level since 2008 and acts as a tailwind for the buck. Apart from this, a generally weaker tone around the equity markets turns out to be another factor that benefits the Greenback’s relative safe-haven status and exerts some pressure on the GBP/USD pair. Against the backdrop of concerns about the worsening economic conditions in China, worries about headwinds stemming from rapidly rising borrowing costs fuel recession fears and weigh on investors’ sentiment.
The downside for the GBP/USD pair, however, seems cushioned, at least for the time being, amid growing acceptance that the UK central bank will raise interest rates again at its next monetary policy meeting in September. The expectations were reaffirmed by stronger UK wage growth data released on Tuesday, which added to worries about long-term inflation. This, along with the upbeat UK GDP report released last week and Wednesday’s slightly higher-than-expected UK CPI print, should allow the BoE to continue tightening its monetary policy.
The aforementioned mixed fundamental backdrop makes it prudent to wait for strong follow-through selling before confirming that the recent bounce from the 100-day Simple Moving Average (SMA), around the 1.2615 region, or the lowest level since June touched last week, has run its course. Market participants now look to the US economic docket, featuring the usual Weekly Initial Jobless Claims and the Philly Fed Manufacturing Index. This, along with the US bond yields will influence the USD and provide some impetus to the GBP/USD pair.
Technical Levels: Supports and Resistances
GBPUSD currently trading at 1.2717 at the time of writing. Pair opened at 1.2732 and is trading with a change of -0.12 % .
| Overview | Overview.1 | |
|---|---|---|
| 0 | Today last price | 1.2717 |
| 1 | Today Daily Change | -0.0015 |
| 2 | Today Daily Change % | -0.1200 |
| 3 | Today daily open | 1.2732 |
The pair is trading below its 20 Daily moving average @ 1.2778, below its 50 Daily moving average @ 1.2781 , above its 100 Daily moving average @ 1.2621 and above its 200 Daily moving average @ 1.2369
| Trends | Trends.1 | |
|---|---|---|
| 0 | Daily SMA20 | 1.2778 |
| 1 | Daily SMA50 | 1.2781 |
| 2 | Daily SMA100 | 1.2621 |
| 3 | Daily SMA200 | 1.2369 |
The previous day high was 1.2766 while the previous day low was 1.2687. The daily 38.2% Fib levels comes at 1.2736, expected to provide resistance. Similarly, the daily 61.8% fib level is at 1.2717, expected to provide support.
Note the levels of interest below:
- Pivot support is noted at 1.269, 1.2649, 1.2611
- Pivot resistance is noted at 1.277, 1.2808, 1.2849
| Levels | Levels.1 |
|---|---|
| Previous Daily High | 1.2766 |
| Previous Daily Low | 1.2687 |
| Previous Weekly High | 1.2819 |
| Previous Weekly Low | 1.2666 |
| Previous Monthly High | 1.3142 |
| Previous Monthly Low | 1.2659 |
| Daily Fibonacci 38.2% | 1.2736 |
| Daily Fibonacci 61.8% | 1.2717 |
| Daily Pivot Point S1 | 1.2690 |
| Daily Pivot Point S2 | 1.2649 |
| Daily Pivot Point S3 | 1.2611 |
| Daily Pivot Point R1 | 1.2770 |
| Daily Pivot Point R2 | 1.2808 |
| Daily Pivot Point R3 | 1.2849 |
[/s2If]
Download Nehcap EAWe have two EAs that are operational on our LIVE accounts.
- EA-FIX: Check out the details here. Download EA-FIX . EA-FIX is a non-grid HFT scalper.
- EA-GROWTH: High quality low dd EA using trend grids. Download EA_GROWTHJoin Our Telegram Group
")


