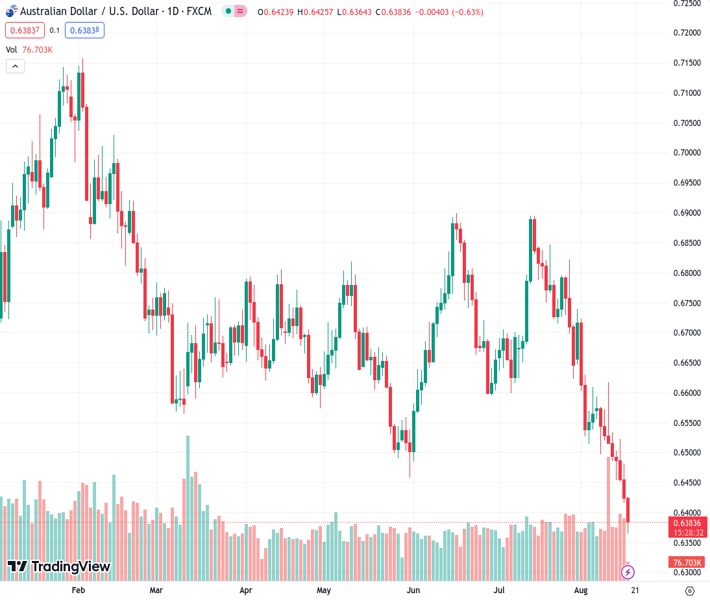
According to “nehcap,” the AUDUSD currency pair is still at a low point for the year and has been consistently decreasing for the past eight days. They predict that the currency pair will continue to decline in the future.
…
This is a premium post.
[s2If !current_user_can(access_s2member_level4)]Please register for FREE REGISTER to read full post below containing analysis. In case of any error or you think you are not able to read the full post below, please email us at support#nehcap.com [lwa][/s2If] [s2If current_user_can(access_s2member_level1)]
- AUD/USD remains depressed at YTD low, prints eight-day downtrend.
The pair currently trades last at 0.63873.
The previous day high was 0.648 while the previous day low was 0.6416. The daily 38.2% Fib levels comes at 0.6441, expected to provide resistance. Similarly, the daily 61.8% fib level is at 0.6456, expected to provide resistance.
AUD/USD bears take a breather after refreshing the yearly low as oversold RSI joins the key Fibonacci ratio to mark an unimpressive effort to prod downside. That said, the Aussie pair dropped to 0.6364 before recently poking 0.6390 heading into Thursday’s European session.
That said, the RSI (14) line stays deep into the oversold territory suggesting an imminent corrective bounce. Also challenging the quote’s further weakness is the 78.6% Fibonacci retracement of the AUD/USD pair’s upside from October 2022 to February 2023, close to 0.6375.
With this, the quote could pare some of its latest losses, which in turn highlights the May month’s bottom of around 0.6460 as an immediate upside hurdle. However, lows marked in late June and early July around the 0.6600 round figure appear the key resistance for the AUD/USD buyers to cross to retake control.
It’s worth noting that the AUD/USD pair’s confirmed the “Double Tops” bearish chart formation earlier in the month by breaking the 0.6600 mark. The same suggests the theoretical target of 0.6300 unless the quote stays beneath 0.6600.
In a case where the AUD/USD pair rises past 0.6600, its run-up towards the early July swing high of around 0.6700 and the monthly peak of 0.6725 can’t be ruled out.
Alternatively, a downside break of the 0.6300 theoretical target will direct AUD/USD toward the previous yearly low of around 0.6170.
Trend: Further downside expected
Technical Levels: Supports and Resistances
AUDUSD currently trading at 0.639 at the time of writing. Pair opened at 0.6424 and is trading with a change of -0.53% % .
| Overview | Overview.1 | |
|---|---|---|
| 0 | Today last price | 0.639 |
| 1 | Today Daily Change | -0.0034 |
| 2 | Today Daily Change % | -0.53% |
| 3 | Today daily open | 0.6424 |
The pair remains strongly bearish on the daily time frame. It trades below the 20 SMA @ 0.6608, 50 SMA 0.6688, 100 SMA @ 0.6675 and 200 SMA @ 0.6737.
| Trends | Trends.1 | |
|---|---|---|
| 0 | Daily SMA20 | 0.6608 |
| 1 | Daily SMA50 | 0.6688 |
| 2 | Daily SMA100 | 0.6675 |
| 3 | Daily SMA200 | 0.6737 |
The previous day high was 0.648 while the previous day low was 0.6416. The daily 38.2% Fib levels comes at 0.6441, expected to provide resistance. Similarly, the daily 61.8% fib level is at 0.6456, expected to provide resistance.
Note the levels of interest below:
- Pivot support is noted at 0.64, 0.6375, 0.6335
- Pivot resistance is noted at 0.6464, 0.6505, 0.6529
| Levels | Levels.1 |
|---|---|
| Previous Daily High | 0.6480 |
| Previous Daily Low | 0.6416 |
| Previous Weekly High | 0.6617 |
| Previous Weekly Low | 0.6486 |
| Previous Monthly High | 0.6895 |
| Previous Monthly Low | 0.6599 |
| Daily Fibonacci 38.2% | 0.6441 |
| Daily Fibonacci 61.8% | 0.6456 |
| Daily Pivot Point S1 | 0.6400 |
| Daily Pivot Point S2 | 0.6375 |
| Daily Pivot Point S3 | 0.6335 |
| Daily Pivot Point R1 | 0.6464 |
| Daily Pivot Point R2 | 0.6505 |
| Daily Pivot Point R3 | 0.6529 |
[/s2If]
Download Nehcap EAWe have two EAs that are operational on our LIVE accounts.
- EA-FIX: Check out the details here. Download EA-FIX . EA-FIX is a non-grid HFT scalper.
- EA-GROWTH: High quality low dd EA using trend grids. Download EA_GROWTHJoin Our Telegram Group
")


