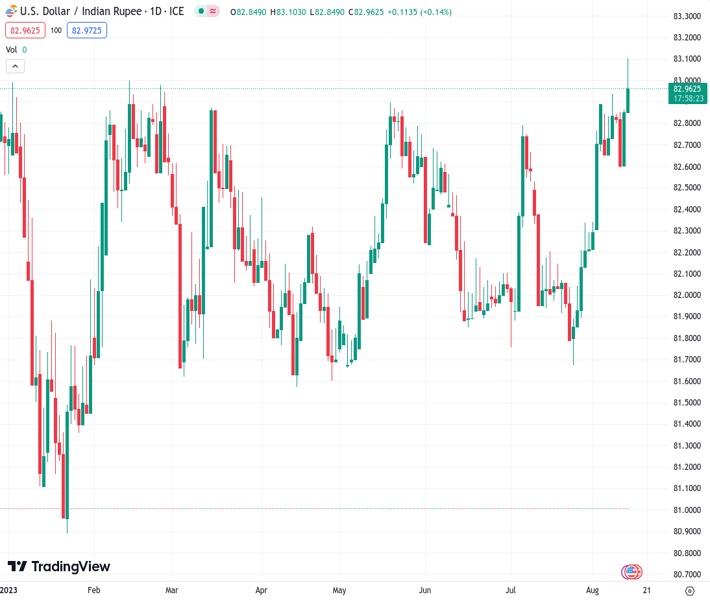
The USDINR currency pair, currently at 82.9730, continues to rise, reaching its highest point since late 2022, and maintaining an upward trend for the past three weeks.
…
This is a premium post.
[s2If !current_user_can(access_s2member_level4)]Please register for FREE REGISTER to read full post below containing analysis. In case of any error or you think you are not able to read the full post below, please email us at support#nehcap.com [lwa][/s2If] [s2If current_user_can(access_s2member_level1)]
- USD/INR takes the bids to prod late 2022 peak, defends three-week uptrend.
The pair currently trades last at 82.9730.
The previous day high was 83.0466 while the previous day low was 82.723. The daily 38.2% Fib levels comes at 82.923, expected to provide support. Similarly, the daily 61.8% fib level is at 82.8467, expected to provide support.
USD/INR bulls cheer risk aversion in Asia, as well as the anxiety ahead of India inflation data, to refresh yearly high near 83.10 during early Monday. In doing so, the Indian Rupee (INR) pair also justifies the domestic struggle to take over China amid the Reserve Bank of India’s (RBI) inaction.
Financial Times (FT) highlights the iPhone maker Foxconn’s cautious optimism about India to cite the hurdles for the Asian economy as it benefits from the global “China plus one” move. Also challenging the INR could be the third weekly fall in the foreign exchange reserves. Furthermore, the RBI’s status quo despite the inflation woes at home, expected to escalate further, also propel the USD/INR prices.
On the other hand, weekend news from China suggests further hardships for the world’s second-largest economy, as well as for the global economic mechanism. Also challenging the sentiment are geopolitical concerns about Russia and the recently firmer US data, which in turn fuel the US Dollar and the USD/INR prices.
China’s Country Garden pauses its bond trading and a few companies from the Dragon Nation complain about not receiving payments from a subsidiary of Chinese conglomerate Zhongzhi Enterprise Group, the debt woes regain momentum.
On the same line, the talks of a liquidity crunch at the Zhongzhi Enterprise Group were out and loud previously and the latest actions confirm the market players’ fears. Elsewhere, the US-China trade war and Russia’s firing of warning shots at a warship in the Black Sea also roil the market’s risk profile.
It’s worth observing that the upbeat US data and strong Oil price also underpin the USD/INR pair’s run-up due to India’s reliance on energy imports. That said, the US Dollar Index (DXY) renews its monthly top near 103.00 while WTI crude oil refreshed its yearly top the last week, easing to $82.45 by the press time.
While portraying the mood, the S&P500 Futures drop 0.20% intraday as it fades the previous day’s corrective bounce off the monthly low whereas the US 10-year Treasury bond yields remain firmer around 4.18% by the press time. Furthermore, the MSCI’s index of Asia-Pacific shares outside Japan drops 1.62% on a day at the latest.
Moving on, India’s Wholesale Price Index (WPI) and Consumer Price Index (CPI) for July will direct intraday moves of the USD/INR pair but major attention will be given to the risk catalysts for clear directions.
A daily closing beyond the tops marked in late 2022 around 83.20 becomes necessary for the USD/INR bulls to challenge the record high marked the last year at around 83.45. On the contrary, the overbought RSI conditions may play a role in dragging the quote. However, the Indian Rupee (INR) pair sellers remain off the table unless witnessing a daily close below July’s peak of around 82.80.
Technical Levels: Supports and Resistances
USDINR currently trading at 83.0173 at the time of writing. Pair opened at 83.029 and is trading with a change of -0.01% % .
| Overview | Overview.1 | |
|---|---|---|
| 0 | Today last price | 83.0173 |
| 1 | Today Daily Change | -0.0117 |
| 2 | Today Daily Change % | -0.01% |
| 3 | Today daily open | 83.029 |
The pair remains strongly bullish on the daily timeframe. It trades above its 20 SMA @ 82.4098, 50 SMA 82.2856, 100 SMA @ 82.2229 and 200 SMA @ 82.1724.
| Trends | Trends.1 | |
|---|---|---|
| 0 | Daily SMA20 | 82.4098 |
| 1 | Daily SMA50 | 82.2856 |
| 2 | Daily SMA100 | 82.2229 |
| 3 | Daily SMA200 | 82.1724 |
The previous day high was 83.0466 while the previous day low was 82.723. The daily 38.2% Fib levels comes at 82.923, expected to provide support. Similarly, the daily 61.8% fib level is at 82.8467, expected to provide support.
Note the levels of interest below:
- Pivot support is noted at 82.8192, 82.6093, 82.4956
- Pivot resistance is noted at 83.1428, 83.2565, 83.4664
| Levels | Levels.1 |
|---|---|
| Previous Daily High | 83.0466 |
| Previous Daily Low | 82.7230 |
| Previous Weekly High | 83.0466 |
| Previous Weekly Low | 82.5854 |
| Previous Monthly High | 82.8334 |
| Previous Monthly Low | 81.6588 |
| Daily Fibonacci 38.2% | 82.9230 |
| Daily Fibonacci 61.8% | 82.8467 |
| Daily Pivot Point S1 | 82.8192 |
| Daily Pivot Point S2 | 82.6093 |
| Daily Pivot Point S3 | 82.4956 |
| Daily Pivot Point R1 | 83.1428 |
| Daily Pivot Point R2 | 83.2565 |
| Daily Pivot Point R3 | 83.4664 |
[/s2If]
Download Nehcap EAWe have two EAs that are operational on our LIVE accounts.
- EA-FIX: Check out the details here. Download EA-FIX . EA-FIX is a non-grid HFT scalper.
- EA-GROWTH: High quality low dd EA using trend grids. Download EA_GROWTHJoin Our Telegram Group
")


