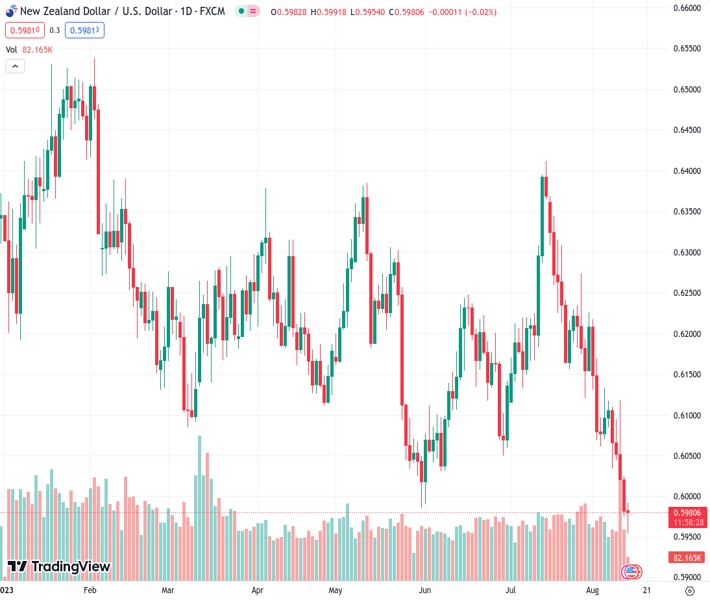
The NZDUSD pair bounces back from its lowest point since November 2022, which was reached earlier on Monday.
…
This is a premium post.
[s2If !current_user_can(access_s2member_level4)]Please register for FREE REGISTER to read full post below containing analysis. In case of any error or you think you are not able to read the full post below, please email us at support#nehcap.com [lwa][/s2If] [s2If current_user_can(access_s2member_level1)]
- NZD/USD rebounds from its lowest level since November 2022 touched earlier this Monday.
The pair currently trades last at 0.59803.
The previous day high was 0.6089 while the previous day low was 0.5974. The daily 38.2% Fib levels comes at 0.6018, expected to provide resistance. Similarly, the daily 61.8% fib level is at 0.6045, expected to provide resistance.
The NZD/USD pair stages a goodish intraday recovery from the vicinity of mid-0.5900s, or its lowest level since November 2022 touched this Monday and hits a fresh daily peak during the early European session. Spot prices currently trade just below the 0.600 psychological mark, up nearly 0.10% for the day, and for now, seem to have snapped a four-day-losing streak, though any meaningful appreciating move still seems elusive.
In the absence of any fresh fundamental catalyst, a positive opening across the European equity markets prompts some profit-taking around the safe-haven US Dollar (USD) and turns out to be a key factor that benefits the risk-sensitive Kiwi. That said, growing worries about the worsening economic conditions in China and geopolitical risks might keep a lid on any optimism. Furthermore, expectations that the Federal Reserve (Fed) will keep interest rates higher for longer should help limit the USD corrective slide from its highest level since July 7 and cap gains for the NZD/USD pair.
Investors seem convinced that the US central bank will stick to its hawkish stance and the bets were reaffirmed by the US PPI on Friday, which rose slightly more than expected in July. This comes on the back of a moderate rise in consumer prices in July and suggests that the battle to bring inflation back to the Fed’s 2% target is far from being won, leaving the door for one more 25 bps lift-off by the end of this year wide open. The outlook remains supportive of elevated US Treasury bond yields and favours the USD bulls, warranting caution before positioning for further NZD/USD upside.
Traders might also refrain from placing aggressive bets and prefer to wait on the sidelines ahead of important Chinese macro data, due for release during the Asian session on Tuesday. The focus will then shift to the Reserve Bank of New Zealand (RBNZ) monetary policy meeting on Wednesday, which will play a key role in influencing the domestic currency and provide a fresh impetus to the NZD/USD pair. In the meantime, the aforementioned fundamental backdrop suggests that the path of least resistance for spot prices is to the downside and the attempted recovery might get sold into.
Technical Levels: Supports and Resistances
NZDUSD currently trading at 0.599 at the time of writing. Pair opened at 0.5984 and is trading with a change of 0.1 % .
| Overview | Overview.1 | |
|---|---|---|
| 0 | Today last price | 0.5990 |
| 1 | Today Daily Change | 0.0006 |
| 2 | Today Daily Change % | 0.1000 |
| 3 | Today daily open | 0.5984 |
The pair remains strongly bearish on the daily time frame. It trades below the 20 SMA @ 0.6153, 50 SMA 0.6164, 100 SMA @ 0.6184 and 200 SMA @ 0.6233.
| Trends | Trends.1 | |
|---|---|---|
| 0 | Daily SMA20 | 0.6153 |
| 1 | Daily SMA50 | 0.6164 |
| 2 | Daily SMA100 | 0.6184 |
| 3 | Daily SMA200 | 0.6233 |
The previous day high was 0.6089 while the previous day low was 0.5974. The daily 38.2% Fib levels comes at 0.6018, expected to provide resistance. Similarly, the daily 61.8% fib level is at 0.6045, expected to provide resistance.
Note the levels of interest below:
- Pivot support is noted at 0.5942, 0.5901, 0.5827
- Pivot resistance is noted at 0.6057, 0.613, 0.6172
| Levels | Levels.1 |
|---|---|
| Previous Daily High | 0.6089 |
| Previous Daily Low | 0.5974 |
| Previous Weekly High | 0.6118 |
| Previous Weekly Low | 0.5974 |
| Previous Monthly High | 0.6413 |
| Previous Monthly Low | 0.6120 |
| Daily Fibonacci 38.2% | 0.6018 |
| Daily Fibonacci 61.8% | 0.6045 |
| Daily Pivot Point S1 | 0.5942 |
| Daily Pivot Point S2 | 0.5901 |
| Daily Pivot Point S3 | 0.5827 |
| Daily Pivot Point R1 | 0.6057 |
| Daily Pivot Point R2 | 0.6130 |
| Daily Pivot Point R3 | 0.6172 |
[/s2If]
Download Nehcap EAWe have two EAs that are operational on our LIVE accounts.
- EA-FIX: Check out the details here. Download EA-FIX . EA-FIX is a non-grid HFT scalper.
- EA-GROWTH: High quality low dd EA using trend grids. Download EA_GROWTHJoin Our Telegram Group
")


