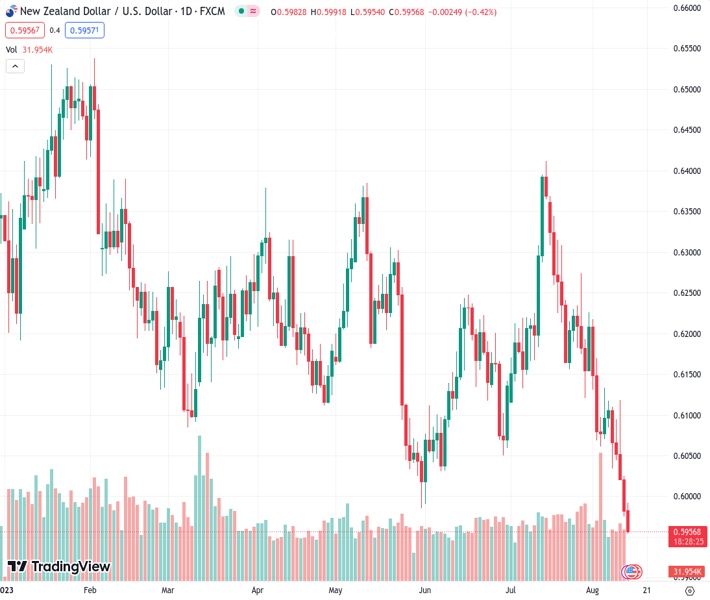
The NZDUSD currency pair, currently at 0.59540, continues to decline for the fifth consecutive day and is experiencing downward pressure due to a combination of various factors.
…
This is a premium post.
[s2If !current_user_can(access_s2member_level4)]Please register for FREE REGISTER to read full post below containing analysis. In case of any error or you think you are not able to read the full post below, please email us at support#nehcap.com [lwa][/s2If] [s2If current_user_can(access_s2member_level1)]
- NZD/USD drifts lower for the fifth successive day and is pressured by a combination of factors.
The pair currently trades last at 0.59540.
The previous day high was 0.6089 while the previous day low was 0.5974. The daily 38.2% Fib levels comes at 0.6018, expected to provide resistance. Similarly, the daily 61.8% fib level is at 0.6045, expected to provide resistance.
The NZD/USD pair remains under some selling pressure for the fifth successive day and drops to its lowest level since November 2022, closer to mid-0.5900s during the Asian session on Monday.
Growing concerns about the worsening economic conditions in China continue to undermine antipodean currencies, including the New Zealand Dollar (NZD), which loses additional ground in reaction to the downbeat domestic data. In fact, Business NZ’s Services Index plunged into contraction territory during July and came in at 47.8 – marking the lowest level since January 2022. Moreover, the previous month’s reading was also revised down to 49.6 from 50.1 and pointed to the slowing economy. This, along with the underlying bullish sentiment surrounding the US Dollar (USD), continues to exert downward pressure on the NZD/USD pair.
In fact, the USD Index (DXY), which tracks the Greenback against a basket of currencies, climbs to its highest level since July 7 and remains supported by expectations that the Federal Reserve (Fed) will stick to its hawkish stance. The bets were reaffirmed by the US PPI on Friday, which climbed slightly more than expected in July. Against the backdrop of a moderate rise in consumer prices in July, the data suggested that the battle to bring inflation back to the Fed’s 2% target is far from being won. This keeps the door open for one more 25 bps Fed rate hike in 2023 and remains supportive of a further rise in the US Treasury bond yields, underpinning the USD.
Apart from the aforementioned fundamental backdrop, Friday’s sustained breakdown below the 0.6000 psychological mark is seen as another factor that prompts some follow-through technical selling around the NZD/USD pair. This, in turn, suggests that the path of least resistance for spot prices is to the downside. Traders, however, might refrain from placing aggressive bets ahead of the crucial Chinese macro data dump on Tuesday and the Reserve Bank of New Zealand (RBNZ) monetary policy meeting on Wednesday.
Technical Levels: Supports and Resistances
NZDUSD currently trading at 0.5958 at the time of writing. Pair opened at 0.5984 and is trading with a change of -0.43 % .
| Overview | Overview.1 | |
|---|---|---|
| 0 | Today last price | 0.5958 |
| 1 | Today Daily Change | -0.0026 |
| 2 | Today Daily Change % | -0.4300 |
| 3 | Today daily open | 0.5984 |
The pair remains strongly bearish on the daily time frame. It trades below the 20 SMA @ 0.6153, 50 SMA 0.6164, 100 SMA @ 0.6184 and 200 SMA @ 0.6233.
| Trends | Trends.1 | |
|---|---|---|
| 0 | Daily SMA20 | 0.6153 |
| 1 | Daily SMA50 | 0.6164 |
| 2 | Daily SMA100 | 0.6184 |
| 3 | Daily SMA200 | 0.6233 |
The previous day high was 0.6089 while the previous day low was 0.5974. The daily 38.2% Fib levels comes at 0.6018, expected to provide resistance. Similarly, the daily 61.8% fib level is at 0.6045, expected to provide resistance.
Note the levels of interest below:
- Pivot support is noted at 0.5942, 0.5901, 0.5827
- Pivot resistance is noted at 0.6057, 0.613, 0.6172
| Levels | Levels.1 |
|---|---|
| Previous Daily High | 0.6089 |
| Previous Daily Low | 0.5974 |
| Previous Weekly High | 0.6118 |
| Previous Weekly Low | 0.5974 |
| Previous Monthly High | 0.6413 |
| Previous Monthly Low | 0.6120 |
| Daily Fibonacci 38.2% | 0.6018 |
| Daily Fibonacci 61.8% | 0.6045 |
| Daily Pivot Point S1 | 0.5942 |
| Daily Pivot Point S2 | 0.5901 |
| Daily Pivot Point S3 | 0.5827 |
| Daily Pivot Point R1 | 0.6057 |
| Daily Pivot Point R2 | 0.6130 |
| Daily Pivot Point R3 | 0.6172 |
[/s2If]
Download Nehcap EAWe have two EAs that are operational on our LIVE accounts.
- EA-FIX: Check out the details here. Download EA-FIX . EA-FIX is a non-grid HFT scalper.
- EA-GROWTH: High quality low dd EA using trend grids. Download EA_GROWTHJoin Our Telegram Group
")


