The AUDUSD exchange rate drops to a new low over concerns about China, Australia’s largest trading partner. @nehcap predicts that there will be more declines in the future.
…
This is a premium post.
[s2If !current_user_can(access_s2member_level4)]Please register for FREE REGISTER to read full post below containing analysis. In case of any error or you think you are not able to read the full post below, please email us at support#nehcap.com [lwa][/s2If] [s2If current_user_can(access_s2member_level1)]
- AUD/USD takes offers to refresh multi-day low amid fears about Australia’s biggest customer China.
The pair currently trades last at 0.64772.
The previous day high was 0.6534 while the previous day low was 0.6486. The daily 38.2% Fib levels comes at 0.6504, expected to provide resistance. Similarly, the daily 61.8% fib level is at 0.6515, expected to provide resistance.
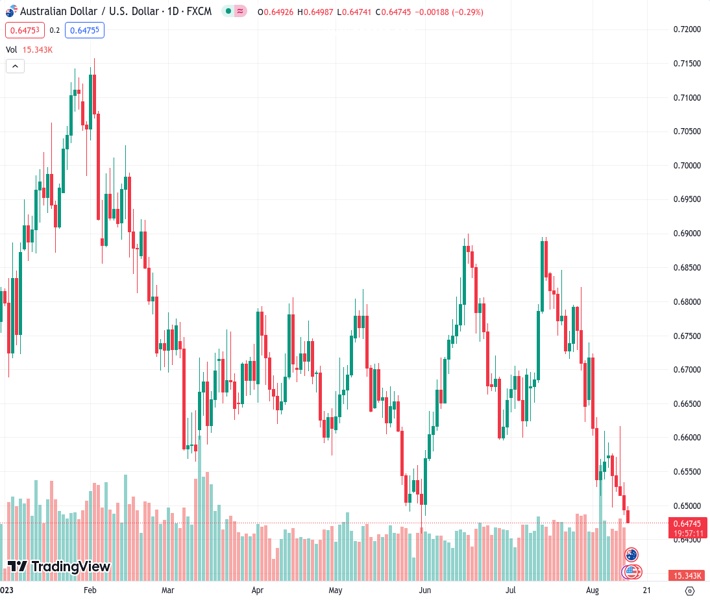
AUD/USD drops to a fresh low since May 31, down 0.25% intraday near 0.6480 by the press time, as fears about China join the firmer US Dollar to weigh on the Aussie pair during the Asian session on Monday. In doing so, the risk-barometer pair pokes the key support line stretched from November 2022 with eyes on the yearly low registered in June.
Also read: China’s Country Garden, Zhongrong Trust renew debt market fears
Technically, the Aussie pair’s sustained trading below the 0.6545–50 resistance confluence, comprising the 10-DMA, ascending trend line from October 2022 and 61.8% Fibonacci retracement of October 2022 to February 2023 upside, keeps the bears hopeful.
Adding credence to the downside bias are the bearish MACD signals.
With this, the AUD/USD bears appear well set to break the immediate 0.6480 support line and aim for the yearly low of 0.6458.
However, a clear downside break of 0.6458 will make the Aussie pair vulnerable to drop towards the 0.6360–50 support zone encompassing the late September 2022 lows and early October 2022 tops.
On the flip side, a daily closing beyond 0.6550 will need validation from the lows marked in late June and early July, close to the 0.6600 round figure.
Trend: Further downside expected
Technical Levels: Supports and Resistances
AUDUSD currently trading at 0.6481 at the time of writing. Pair opened at 0.6496 and is trading with a change of -0.23% % .
| Overview | Overview.1 | |
|---|---|---|
| 0 | Today last price | 0.6481 |
| 1 | Today Daily Change | -0.0015 |
| 2 | Today Daily Change % | -0.23% |
| 3 | Today daily open | 0.6496 |
The pair remains strongly bearish on the daily time frame. It trades below the 20 SMA @ 0.666, 50 SMA 0.67, 100 SMA @ 0.6682 and 200 SMA @ 0.6737.
| Trends | Trends.1 | |
|---|---|---|
| 0 | Daily SMA20 | 0.6660 |
| 1 | Daily SMA50 | 0.6700 |
| 2 | Daily SMA100 | 0.6682 |
| 3 | Daily SMA200 | 0.6737 |
The previous day high was 0.6534 while the previous day low was 0.6486. The daily 38.2% Fib levels comes at 0.6504, expected to provide resistance. Similarly, the daily 61.8% fib level is at 0.6515, expected to provide resistance.
Note the levels of interest below:
- Pivot support is noted at 0.6477, 0.6458, 0.643
- Pivot resistance is noted at 0.6525, 0.6553, 0.6572
| Levels | Levels.1 |
|---|---|
| Previous Daily High | 0.6534 |
| Previous Daily Low | 0.6486 |
| Previous Weekly High | 0.6617 |
| Previous Weekly Low | 0.6486 |
| Previous Monthly High | 0.6895 |
| Previous Monthly Low | 0.6599 |
| Daily Fibonacci 38.2% | 0.6504 |
| Daily Fibonacci 61.8% | 0.6515 |
| Daily Pivot Point S1 | 0.6477 |
| Daily Pivot Point S2 | 0.6458 |
| Daily Pivot Point S3 | 0.6430 |
| Daily Pivot Point R1 | 0.6525 |
| Daily Pivot Point R2 | 0.6553 |
| Daily Pivot Point R3 | 0.6572 |
[/s2If]
Download Nehcap EAWe have two EAs that are operational on our LIVE accounts.
- EA-FIX: Check out the details here. Download EA-FIX . EA-FIX is a non-grid HFT scalper.
- EA-GROWTH: High quality low dd EA using trend grids. Download EA_GROWTHJoin Our Telegram Group
")


