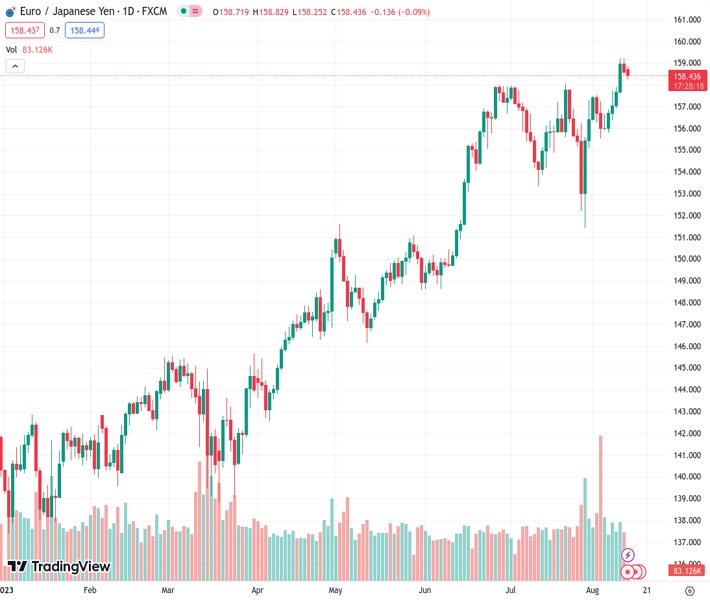
EURJPY at 158.446 experiences a decline for the second day in a row on Monday, but fails to sustain further downward movement.
…
This is a premium post.
[s2If !current_user_can(access_s2member_level4)]Please register for FREE REGISTER to read full post below containing analysis. In case of any error or you think you are not able to read the full post below, please email us at support#nehcap.com [lwa][/s2If] [s2If current_user_can(access_s2member_level1)]
- EUR/JPY edges lower for the second successive day on Monday, albeit lacks follow-through.
The pair currently trades last at 158.446.
The previous day high was 159.22 while the previous day low was 158.53. The daily 38.2% Fib levels comes at 158.8, expected to provide resistance. Similarly, the daily 61.8% fib level is at 158.96, expected to provide resistance.
The EUR/JPY cross kicks off the new week on a softer note and moves further await from its highest level since September 2008, around the 159.20 region touched on Friday. Spot prices drop to the 158.25 region during the Asian session, down for the second straight day, though any meaningful corrective decline still seems elusive.
Speculations that the recent weakness in the Japanese Yen (JPY) might prompt some jawboning from authorities or even lead to an intervention in the foreign exchange markets turn out to be a key factor acting as a headwind for the EUR/JPY cross. Apart from this, a generally weaker tone around the Asian equity markets benefits the safe-haven JPY and exerts some downward pressure on spot prices. Against the backdrop of growing concerns about the worsening economic conditions in China and US-China tensions, geopolitical risks temper investors’ appetite for riskier assets and drive some haven flows towards the JPY.
It is worth recalling that US President Joe Biden last week signed an executive order, which prohibits new US investment in China in sensitive technologies like computer chips and requires government notification in other tech sectors. Adding to this, Taiwan Vice President William Lai left on Saturday for a sensitive trip to the US, which China has condemned. Furthermore, Taiwanese officials fear that the trip could prompt more Chinese military activity around the democratically governed island. Meanwhile, China’s Commerce Ministry announced an anti-dumping tariff for polycarbonate imported from Taiwan effective from August 15.
On the geopolitical front, the Russian warship fired warning shots at a cargo ship in the southwestern Black Sea on Sunday and further tempers investors’ appetite for riskier assets. That said, the Bank of Japan’s (BoJ) dovish stance might keep a lid on any further gains for the JPY and helps limit the downside for the EUR/JPY cross, at least for the time being. In fact, policymakers have stressed that steps taken in July to make the BoJ’s Yield Curve Control (YCC) policy more flexible and allow yield on the 10-year Japanese government bond to move up toward 1% was a technical tweak aimed at extending the shelf life of stimulus.
In contrast, the European Central Bank (ECB) has raised borrowing costs by a combined 425 bps since last July. Moreover, the markets are still pricing in a greater chance of one more rate hike by the end of this year. This marks a big divergence in the monetary policy stance adopted by the two major central banks and supports prospects for the emergence of some dip-buying around the EUR/JPY cross. Hence, it will be prudent to wait for strong follow-through selling before confirming that spot prices have topped out in the near term and positioning for any meaningful corrective pullback.
Technical Levels: Supports and Resistances
EURJPY currently trading at 158.44 at the time of writing. Pair opened at 158.72 and is trading with a change of -0.18 % .
| Overview | Overview.1 | |
|---|---|---|
| 0 | Today last price | 158.44 |
| 1 | Today Daily Change | -0.28 |
| 2 | Today Daily Change % | -0.18 |
| 3 | Today daily open | 158.72 |
The pair remains strongly bullish on the daily timeframe. It trades above its 20 SMA @ 156.52, 50 SMA 155.33, 100 SMA @ 151.38 and 200 SMA @ 147.02.
| Trends | Trends.1 | |
|---|---|---|
| 0 | Daily SMA20 | 156.52 |
| 1 | Daily SMA50 | 155.33 |
| 2 | Daily SMA100 | 151.38 |
| 3 | Daily SMA200 | 147.02 |
The previous day high was 159.22 while the previous day low was 158.53. The daily 38.2% Fib levels comes at 158.8, expected to provide resistance. Similarly, the daily 61.8% fib level is at 158.96, expected to provide resistance.
Note the levels of interest below:
- Pivot support is noted at 158.43, 158.14, 157.74
- Pivot resistance is noted at 159.12, 159.52, 159.81
| Levels | Levels.1 |
|---|---|
| Previous Daily High | 159.22 |
| Previous Daily Low | 158.53 |
| Previous Weekly High | 159.22 |
| Previous Weekly Low | 155.81 |
| Previous Monthly High | 158.05 |
| Previous Monthly Low | 151.41 |
| Daily Fibonacci 38.2% | 158.80 |
| Daily Fibonacci 61.8% | 158.96 |
| Daily Pivot Point S1 | 158.43 |
| Daily Pivot Point S2 | 158.14 |
| Daily Pivot Point S3 | 157.74 |
| Daily Pivot Point R1 | 159.12 |
| Daily Pivot Point R2 | 159.52 |
| Daily Pivot Point R3 | 159.81 |
[/s2If]
Download Nehcap EAWe have two EAs that are operational on our LIVE accounts.
- EA-FIX: Check out the details here. Download EA-FIX . EA-FIX is a non-grid HFT scalper.
- EA-GROWTH: High quality low dd EA using trend grids. Download EA_GROWTHJoin Our Telegram Group
")


