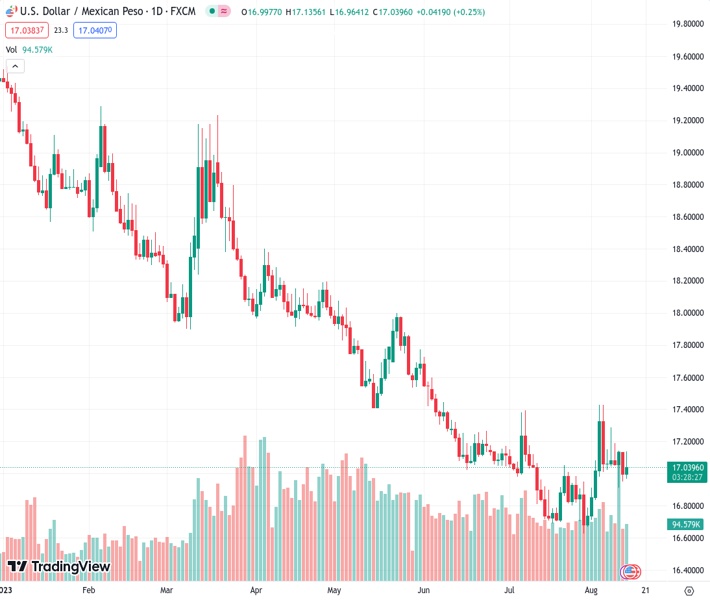
Despite Wall Street’s positive sentiment, the USDMXN currency pair has made a recovery from the 20-day EMA and is currently trading at a higher value of 17.0404.
…
This is a premium post.
[s2If !current_user_can(access_s2member_level4)]Please register for FREE REGISTER to read full post below containing analysis. In case of any error or you think you are not able to read the full post below, please email us at support#nehcap.com [lwa][/s2If] [s2If current_user_can(access_s2member_level1)]
- USD/MXN rebounds from 20-day EMA, trading higher despite Wall Street’s positive sentiment.
The pair currently trades last at 17.0404.
The previous day high was 17.1384 while the previous day low was 16.9515. The daily 38.2% Fib levels comes at 17.0229, expected to provide support. Similarly, the daily 61.8% fib level is at 17.067, expected to provide resistance.
USD/MXN began the session positively and bounced off the 20-day Exponential Moving Average (EMA) at 17.0040, even though market sentiment improved, as shown by Wall Street turning green. The USD/MXN is trading at 17.0685m, post gains of 0.42%.
US equities trade mixed during the North American session, while the Mexican Peso (MXN) gets battered on a risk-off impulse that spurred outflows from the emerging market currency towards the US Dollar (USD), as portrayed by the USD/MXN exchange rate. A jump in US Treasury bond yields underpinned the Greenback after the 10-year benchmark note rate touched a multi-year high of 4.20%.
China’s real estate woes, which initially involved Evergrande in 2021, spilled over its largest private developer Country Garde, which failed to pay its bond interest last week. Real estate in China has suffered tumbling sales as tight liquidity conditions triggered a series of defaults.
Aside from this, the US economic docket would reveal Retail sales for July, estimated to show consumers’ resilience, and Fed speakers on Tuesday. By Wednesday, the release of the latest Federal Open Market Committee (FOMC) minutes could shed light on the Federal Reserve’s (Fed) forward path. At the same time, Industrial Production is estimated to print gains.
Across the border, the Mexican docket is light. That would leave traders adrift to US Dollar dynamics and market sentiment. A risk-on is USD/MXN negative, while risk aversion could pave the way for further USD/MXN upside.
The USD/MXN daily chart portrays the pair as neutral to downward biased, but buyers stepping in around the day’s low opened the door for a recovery above the psychological 17.0000 figure. Of note, the Relative Strength Index (RSI) turned bullish, suggesting that the USD/MXN could be bottoming at around the 16.60-17.00 range, opening the door for further upside. USD/MXN buyers can gain tracti9on above the May 17 low of 17.4038, followed by the 100-day EMA at 17.4671, after reclaiming the 50-day EMA at 17.1228.
Technical Levels: Supports and Resistances
USDMXN currently trading at 17.0521 at the time of writing. Pair opened at 17.0024 and is trading with a change of 0.29 % .
| Overview | Overview.1 | |
|---|---|---|
| 0 | Today last price | 17.0521 |
| 1 | Today Daily Change | 0.0497 |
| 2 | Today Daily Change % | 0.2900 |
| 3 | Today daily open | 17.0024 |
The pair is trading above its 20 Daily moving average @ 16.9344, below its 50 Daily moving average @ 17.0559 , below its 100 Daily moving average @ 17.4834 and below its 200 Daily moving average @ 18.2501
| Trends | Trends.1 | |
|---|---|---|
| 0 | Daily SMA20 | 16.9344 |
| 1 | Daily SMA50 | 17.0559 |
| 2 | Daily SMA100 | 17.4834 |
| 3 | Daily SMA200 | 18.2501 |
The previous day high was 17.1384 while the previous day low was 16.9515. The daily 38.2% Fib levels comes at 17.0229, expected to provide support. Similarly, the daily 61.8% fib level is at 17.067, expected to provide resistance.
Note the levels of interest below:
- Pivot support is noted at 16.9232, 16.8439, 16.7362
- Pivot resistance is noted at 17.1101, 17.2177, 17.297
| Levels | Levels.1 |
|---|---|
| Previous Daily High | 17.1384 |
| Previous Daily Low | 16.9515 |
| Previous Weekly High | 17.2852 |
| Previous Weekly Low | 16.9101 |
| Previous Monthly High | 17.3957 |
| Previous Monthly Low | 16.6258 |
| Daily Fibonacci 38.2% | 17.0229 |
| Daily Fibonacci 61.8% | 17.0670 |
| Daily Pivot Point S1 | 16.9232 |
| Daily Pivot Point S2 | 16.8439 |
| Daily Pivot Point S3 | 16.7362 |
| Daily Pivot Point R1 | 17.1101 |
| Daily Pivot Point R2 | 17.2177 |
| Daily Pivot Point R3 | 17.2970 |
[/s2If]
Download Nehcap EAWe have two EAs that are operational on our LIVE accounts.
- EA-FIX: Check out the details here. Download EA-FIX . EA-FIX is a non-grid HFT scalper.
- EA-GROWTH: High quality low dd EA using trend grids. Download EA_GROWTHJoin Our Telegram Group
")


