The price of silver, represented by #XAGUSD, is continuing to decline and is currently at a one-month low. After experiencing losses for three consecutive days, the silver price remains under pressure. According to the viewpoint of @nehcap, it is expected that the silver price will continue to decrease further.
…
This is a premium post.
[s2If !current_user_can(access_s2member_level4)]Please register for FREE REGISTER to read full post below containing analysis. In case of any error or you think you are not able to read the full post below, please email us at support#nehcap.com [lwa][/s2If] [s2If current_user_can(access_s2member_level1)]
- Silver Price remains pressured at one-month low after three-day losing streak.
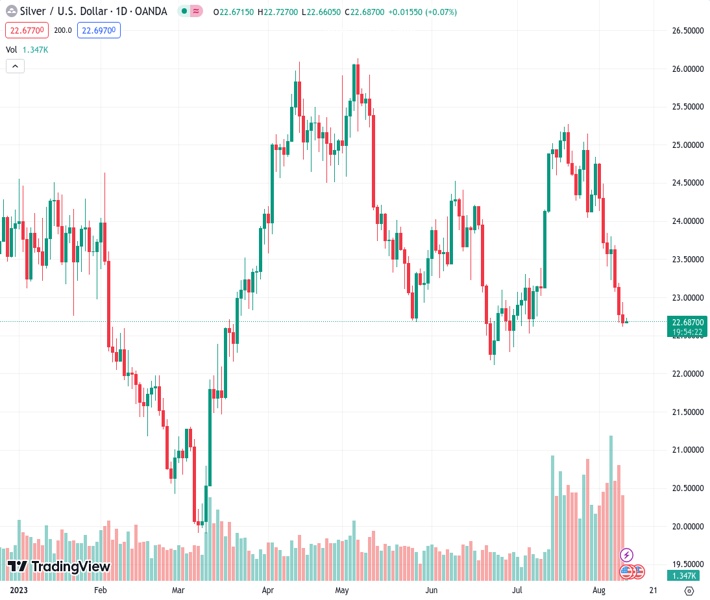
The pair currently trades last at 22.697.
The previous day high was 22.94 while the previous day low was 22.62. The daily 38.2% Fib levels comes at 22.74, expected to provide resistance. Similarly, the daily 61.8% fib level is at 22.82, expected to provide resistance.
Silver Price (XAG/USD) holds lower grounds near $22.70 as bears await the US inflation data on early Thursday. In doing so, the XAG/USD stays depressed at the lowest level in a month after declining in the last three consecutive days.
It’s worth noting that the bearish MACD signals keep the Silver sellers hopeful as the commodity defends the early-week break of the 200-DMA and an upward-sloping support line from early March, now immediate resistance near $23.10.
However, the RSI (14) line is near the oversold territory, suggesting limited downside room for the XAG/USD, which in turn highlights a horizontal area comprising multiple levels marked since November 2022 around $22.20–10. Also acting as a downside filter is the $22.00 round figure.
In a case where the Silver Price drops below $22.00, the early March swing high of around $21.30 will be in the spotlight.
Alternatively, an upside break of the support-turned-resistance line of around $23.10 isn’t an open invitation to the Silver buyers as the 200-DMA hurdle surrounding $23.30 also challenges the bright metal’s upside momentum.
Following that, the tops marked in June and July, respectively around $24.55 and $25.25 should lure the XAG/USD bulls.
Trend: Further downside expected
Technical Levels: Supports and Resistances
XAGUSD currently trading at 22.69 at the time of writing. Pair opened at 22.67 and is trading with a change of 0.09% % .
| Overview | Overview.1 | |
|---|---|---|
| 0 | Today last price | 22.69 |
| 1 | Today Daily Change | 0.02 |
| 2 | Today Daily Change % | 0.09% |
| 3 | Today daily open | 22.67 |
The pair remains strongly bearish on the daily time frame. It trades below the 20 SMA @ 24.26, 50 SMA 23.7, 100 SMA @ 24.06 and 200 SMA @ 23.22.
| Trends | Trends.1 | |
|---|---|---|
| 0 | Daily SMA20 | 24.26 |
| 1 | Daily SMA50 | 23.70 |
| 2 | Daily SMA100 | 24.06 |
| 3 | Daily SMA200 | 23.22 |
The previous day high was 22.94 while the previous day low was 22.62. The daily 38.2% Fib levels comes at 22.74, expected to provide resistance. Similarly, the daily 61.8% fib level is at 22.82, expected to provide resistance.
Note the levels of interest below:
- Pivot support is noted at 22.55, 22.43, 22.23
- Pivot resistance is noted at 22.86, 23.06, 23.18
| Levels | Levels.1 |
|---|---|
| Previous Daily High | 22.94 |
| Previous Daily Low | 22.62 |
| Previous Weekly High | 24.84 |
| Previous Weekly Low | 23.23 |
| Previous Monthly High | 25.27 |
| Previous Monthly Low | 22.52 |
| Daily Fibonacci 38.2% | 22.74 |
| Daily Fibonacci 61.8% | 22.82 |
| Daily Pivot Point S1 | 22.55 |
| Daily Pivot Point S2 | 22.43 |
| Daily Pivot Point S3 | 22.23 |
| Daily Pivot Point R1 | 22.86 |
| Daily Pivot Point R2 | 23.06 |
| Daily Pivot Point R3 | 23.18 |
[/s2If]
Download Nehcap EAWe have two EAs that are operational on our LIVE accounts.
- EA-FIX: Check out the details here. Download EA-FIX . EA-FIX is a non-grid HFT scalper.
- EA-GROWTH: High quality low dd EA using trend grids. Download EA_GROWTHJoin Our Telegram Group
")


