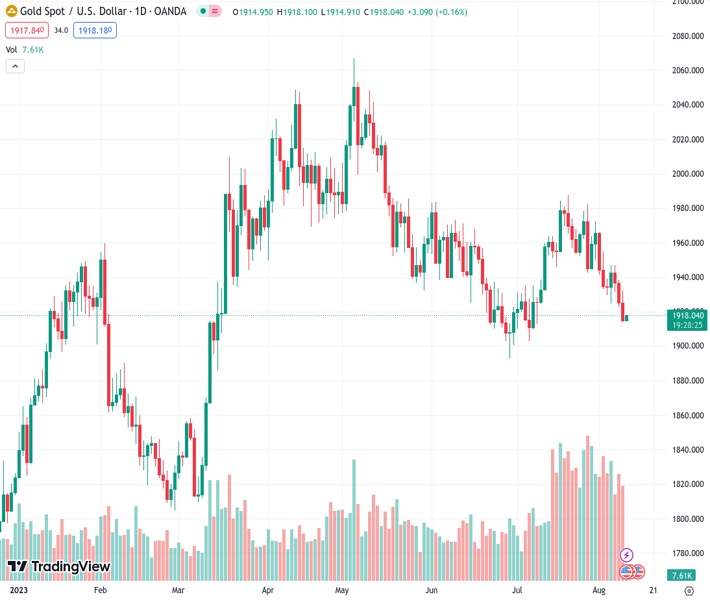
The price of gold, represented by #XAUUSD, increased slightly during the Asian session on Thursday but did not sustain its upward movement.
…
This is a premium post.
[s2If !current_user_can(access_s2member_level4)]Please register for FREE REGISTER to read full post below containing analysis. In case of any error or you think you are not able to read the full post below, please email us at support#nehcap.com [lwa][/s2If] [s2If current_user_can(access_s2member_level1)]
- Gold price edges higher during the Asian session on Thursday, albeit lacks follow-through.
The pair currently trades last at 1917.14.
The previous day high was 1932.43 while the previous day low was 1914.11. The daily 38.2% Fib levels comes at 1921.11, expected to provide resistance. Similarly, the daily 61.8% fib level is at 1925.43, expected to provide resistance.
Gold price attracts some buyers during the Asian session on Thursday and for now, seems to have snapped a three-day losing streak to a one-month low, around the $1,913 area touched the previous day. The XAU/USD, however, lacks follow-through or bullish conviction and currently trades around the $1,916-$1,917 region, up just over 0.10% for the day.
The intraday uptick, meanwhile, could be attributed to some repositioning trade ahead of the latest consumer inflation figures from the United States (US), due for release later today. The crucial Consumer Price Index (CPI) report will play a key role in influencing the Federal Reserve’s (Fed) future rate hike path and help investors to determine the next leg of a directional move for the non-yielding Gold price. In the meantime, the prospects for further policy tightening by the US central bank could act as a headwind for the XAU/USD.
In fact, market participants now seem convinced that the US central bank will stick to its hawkish stance and keep interest rates higher for longer amid hopes of a soft landing for the resilient domestic economy. This, in turn, remains supportive of elevated US Treasury bond yields and continues to act as a tailwind for the US Dollar (USD). A stronger Greenback might also contribute to capping the US Dollar-denominated commodity and warrants some caution before confirming that the Gold price has already formed a near-term bottom.
Heading into the key data risk, worries about the worsening economic conditions in China, fueled by this week’s weaker macro data, could lend support to the safe-haven precious metal. In fact, Chinese inflation figures released on Wednesday showed that the headline CPI turned negative for the first time since February 2021 and the Producer Price Index (PPI) fell for the 10th consecutive month in July. This comes on the back of rather disappointing trade data on Tuesday and suggested that the post-COVID economy recovery is losing steam.
Nevertheless, the aforementioned fundamental backdrop still seems tilted in favour of bearish traders and suggests that the path of least resistance for the Gold price is to the downside. Hence, any subsequent move up might still be seen as a selling opportunity and runs the risk of fizzling out rather quickly.
Technical Levels: Supports and Resistances
XAUUSD currently trading at 1915.83 at the time of writing. Pair opened at 1914.2 and is trading with a change of 0.09 % .
| Overview | Overview.1 | |
|---|---|---|
| 0 | Today last price | 1915.83 |
| 1 | Today Daily Change | 1.63 |
| 2 | Today Daily Change % | 0.09 |
| 3 | Today daily open | 1914.20 |
The pair is trading below its 20 Daily moving average @ 1952.6, below its 50 Daily moving average @ 1943.38 , below its 100 Daily moving average @ 1967.77 and above its 200 Daily moving average @ 1899.15
| Trends | Trends.1 | |
|---|---|---|
| 0 | Daily SMA20 | 1952.60 |
| 1 | Daily SMA50 | 1943.38 |
| 2 | Daily SMA100 | 1967.77 |
| 3 | Daily SMA200 | 1899.15 |
The previous day high was 1932.43 while the previous day low was 1914.11. The daily 38.2% Fib levels comes at 1921.11, expected to provide resistance. Similarly, the daily 61.8% fib level is at 1925.43, expected to provide resistance.
Note the levels of interest below:
- Pivot support is noted at 1908.06, 1901.93, 1889.74
- Pivot resistance is noted at 1926.38, 1938.57, 1944.7
| Levels | Levels.1 |
|---|---|
| Previous Daily High | 1932.43 |
| Previous Daily Low | 1914.11 |
| Previous Weekly High | 1972.45 |
| Previous Weekly Low | 1925.72 |
| Previous Monthly High | 1987.54 |
| Previous Monthly Low | 1902.77 |
| Daily Fibonacci 38.2% | 1921.11 |
| Daily Fibonacci 61.8% | 1925.43 |
| Daily Pivot Point S1 | 1908.06 |
| Daily Pivot Point S2 | 1901.93 |
| Daily Pivot Point S3 | 1889.74 |
| Daily Pivot Point R1 | 1926.38 |
| Daily Pivot Point R2 | 1938.57 |
| Daily Pivot Point R3 | 1944.70 |
[/s2If]
Download Nehcap EAWe have two EAs that are operational on our LIVE accounts.
- EA-FIX: Check out the details here. Download EA-FIX . EA-FIX is a non-grid HFT scalper.
- EA-GROWTH: High quality low dd EA using trend grids. Download EA_GROWTHJoin Our Telegram Group
")


