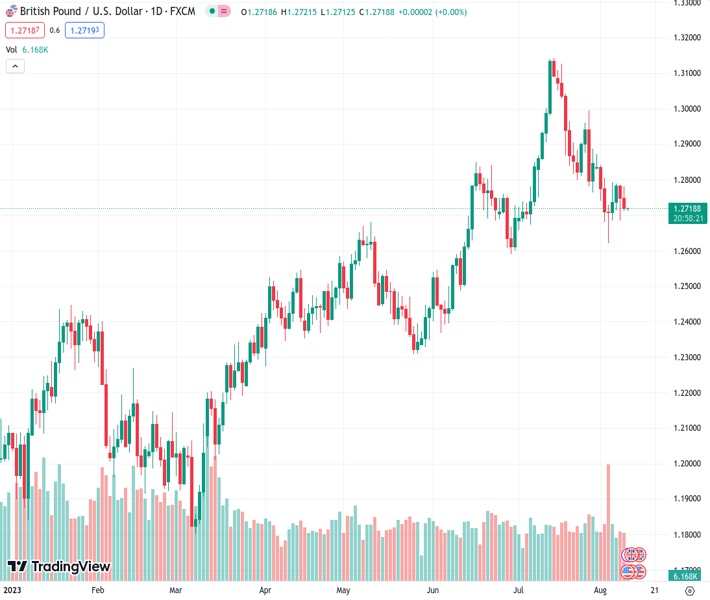
The GBPUSD currency pair, currently trading at 1.27195, continues to face negative pressure within a symmetrical triangle pattern that has been in place for one week. The outlook from @nehcap suggests that there is likely to be additional downward movement in price.
…
This is a premium post.
[s2If !current_user_can(access_s2member_level4)]Please register for FREE REGISTER to read full post below containing analysis. In case of any error or you think you are not able to read the full post below, please email us at support#nehcap.com [lwa][/s2If] [s2If current_user_can(access_s2member_level1)]
- GBP/USD remains on the back foot inside one-week-old symmetrical triangle.
The pair currently trades last at 1.27195.
The previous day high was 1.2787 while the previous day low was 1.2684. The daily 38.2% Fib levels comes at 1.2723, expected to provide resistance. Similarly, the daily 61.8% fib level is at 1.2748, expected to provide resistance.
GBP/USD seesaws around 1.2720 while portraying the pre-data anxiety on early Thursday, after declining in the last two consecutive days.
Apart from the cautious mood ahead of the US Consumer Price Index (CPI) for August, the preliminary readings of the UK’s second quarter (Q2) Gross Domestic Product (GDP), the Cable pair also justifies an absence of major data/events during the Asian session. With this, the Pound Sterling stays within a one-week-old symmetrical triangle, currently between 1.2700 and 1.2785.
Also read: GBP/USD slumps below 50-DMA ahead of US inflation, UK’s GDP figures
Even if the aforementioned catalysts restrict the GBP/USD pair’s immediate moves, the quote’s sustained trading below the 50-SMA, as well as within a three-week-old bearish channel, joins the steady RSI (14) to keep sellers hopeful.
However, a clear break of 1.2700 becomes necessary for the Cable bears to visit June’s bottom of around 1.2590.
Following that, the stated channel’s bottom line, close to 1.2550 at the latest, could challenge the Pound Sterling sellers.
Meanwhile, the 50-SMA surrounding 1.2760 restricts the immediate upside of the GBP/USD pair ahead of the 1.2780-85 resistance confluence including the top lines of the stated triangle and the channel.
In a case where the GBP/USD manages to cross the 1.2785 hurdle, the odds of witnessing a rally towards the late July swing high of around 1.3000 can’t be ruled out.
Trend: Further downside expected
Technical Levels: Supports and Resistances
GBPUSD currently trading at 1.272 at the time of writing. Pair opened at 1.2748 and is trading with a change of -0.22% % .
| Overview | Overview.1 | |
|---|---|---|
| 0 | Today last price | 1.272 |
| 1 | Today Daily Change | -0.0028 |
| 2 | Today Daily Change % | -0.22% |
| 3 | Today daily open | 1.2748 |
The pair is trading below its 20 Daily moving average @ 1.2881, below its 50 Daily moving average @ 1.2751 , above its 100 Daily moving average @ 1.2596 and above its 200 Daily moving average @ 1.233
| Trends | Trends.1 | |
|---|---|---|
| 0 | Daily SMA20 | 1.2881 |
| 1 | Daily SMA50 | 1.2751 |
| 2 | Daily SMA100 | 1.2596 |
| 3 | Daily SMA200 | 1.2330 |
The previous day high was 1.2787 while the previous day low was 1.2684. The daily 38.2% Fib levels comes at 1.2723, expected to provide resistance. Similarly, the daily 61.8% fib level is at 1.2748, expected to provide resistance.
Note the levels of interest below:
- Pivot support is noted at 1.2693, 1.2637, 1.259
- Pivot resistance is noted at 1.2795, 1.2842, 1.2898
| Levels | Levels.1 |
|---|---|
| Previous Daily High | 1.2787 |
| Previous Daily Low | 1.2684 |
| Previous Weekly High | 1.2873 |
| Previous Weekly Low | 1.2621 |
| Previous Monthly High | 1.3142 |
| Previous Monthly Low | 1.2659 |
| Daily Fibonacci 38.2% | 1.2723 |
| Daily Fibonacci 61.8% | 1.2748 |
| Daily Pivot Point S1 | 1.2693 |
| Daily Pivot Point S2 | 1.2637 |
| Daily Pivot Point S3 | 1.2590 |
| Daily Pivot Point R1 | 1.2795 |
| Daily Pivot Point R2 | 1.2842 |
| Daily Pivot Point R3 | 1.2898 |
[/s2If]
Download Nehcap EAWe have two EAs that are operational on our LIVE accounts.
- EA-FIX: Check out the details here. Download EA-FIX . EA-FIX is a non-grid HFT scalper.
- EA-GROWTH: High quality low dd EA using trend grids. Download EA_GROWTHJoin Our Telegram Group
")


